As part of my application for a Data Analyst role at IDEA Public Schools, I designed and conducted an original survey to explore how different high school experiences impact college readiness and student success. The project compares students from IDEA Public Schools to those from traditional public schools and other educational backgrounds. The analysis focuses on key factors such as dual enrollment, extracurricular involvement, skill development, family engagement, and alignment between high school preparation and college major.
2 Analysis Approach
The analysis focuses on identifying patterns and relationships between key aspects of students’ high school experiences and their outcomes in college. For each comparison, results are presented separately for IDEA and non-IDEA students. The methods and visualizations for each analysis are specified below.
Dual enrollment participation (Q7):
Compared with:
Q4: College preparedness
Q9: Time management confidence during first semester of college
Purpose: Does taking college-level courses in high school improve college readiness or confidence in managing responsibilities?
Methods: Group comparisons (means)
Visualization: Bar charts
Extracurricular involvement (Q8):
Compared with:
Q4: College preparedness
Q9: Time management confidence during first semester of college
Purpose: Is there a relationship between extracurricular involvement in high school and students’ college readiness or time management skills in college?
Methods: Group comparisons (means)
Visualization: Bar charts
Family engagement (Q12):
Compared with:
Q4: College preparedness
Purpose: How does family involvement during high school relate to students’ sense of college readiness?
Methods: Group comparisons (means)
Visualization: Bar charts
Skills development (Q10):
Compared with:
Q4: College preparedness
Purpose: Which high school experiences are most strongly associated with feeling ready for college?
Methods: Group comparisons (means)
Visualization: Bar charts
Academic support received (Q5):
Compared with:
Q4: College preparedness
Purpose: Does the quality of academic support in high school relate to higher college preparedness?
Methods: Group comparisons (means)
Visualization: Bar charts
Quality of teaching and teacher care (Q13 & Q14):
Compared with:
Q4: College preparedness
Purpose: Are students’ perceptions of teaching quality and teacher support associated with greater college readiness?
Methods: Group comparisons (means)
Visualization: Bar charts
Breadth of support services (Q6):
Compared with:
Q4: College preparedness
Q9: Time management confidence
Purpose: Does having access to a wider range of support services in high school relate to higher preparedness and better time management skills? Which individual supports are most strongly associated with higher scores?
Methods: Group comparisons (means); count of support services
Visualization: Bar charts, Line charts
Due to the small number of survey responses, the analysis focuses on group comparisons using averages (means) to highlight trends and differences across groups. More advanced statistical methods were not applied, as they would not yield reliable results with this sample size. All visualizations are created in Quarto to present findings clearly for educational leaders.
Note: In all visualizations, results are shown separately for IDEA and non-IDEA students, and categories with no responses are omitted for clarity. The full list of survey response options is included in the appendix.
3 Likert Scale Mapping
Several survey questions used Likert-style or ordinal response formats (for example, “Very confident” to “Not at all confident”, “Excellent” to “Very poor”, or “Strongly agree” to “Strongly disagree”). To enable statistical analysis, these responses were mapped to corresponding numeric values on a 1 to 5 scale, with higher values representing more positive outcomes or stronger agreement. This allowed for the calculation of means, correlations, and regression models while preserving the ordinal nature of the data.
4 Key Insights
This section summarizes the most important findings from the survey analysis. The goal is to highlight actionable insights that could inform decisions around school practices, program investments, and student support strategies. The following key patterns emerged from the data:
Impact of Dual Enrollment: Students who participated in dual enrollment or AP courses reported higher levels of college preparedness and stronger time management confidence compared to those who did not take advanced courses. Among IDEA students, every respondent participated in some form of advanced coursework and reported high preparedness. In the non-IDEA group, the highest scores were also associated with dual enrollment or AP participation, while the only students who felt completely unprepared had not taken any advanced courses or expressed regret about their dual enrollment experience.
Extracurricular Involvement: Students who reported greater involvement in extracurriculars generally felt more prepared for college and more confident managing their time. This pattern held for both IDEA and non-IDEA students, though a few non-IDEA students who reported no extracurricular involvement still felt highly prepared. Outliers suggest that lack of alignment between school supports and students’ career interests can undermine preparedness even among highly involved students.
Family Engagement: Among non-IDEA students, greater family involvement was associated with higher college preparedness. Among IDEA students, results were more mixed, likely due to small sample size. Some students with highly involved families still reported low preparedness, suggesting that family support alone may not compensate for gaps in school support or guidance.
Skills Development: Students who strongly agreed that their high school helped them develop key academic skills generally reported higher college preparedness. IDEA students who selected “Strongly agree” for each skill consistently reported the highest preparedness ratings. However, several students across both groups felt well prepared for college even when reporting weak skill development, reflecting how individual pathways and experiences can shape perceptions of readiness.
Academic Support: Among non-IDEA students, stronger academic support was clearly linked to higher preparedness. Among IDEA students, results were more varied, with some students rating their support as “Poor” or “Very poor” yet still reporting high preparedness. This may reflect differences in the quality of supports across campuses or differences in how students interpret academic support.
Quality of teaching and teaching care: Higher perceived teaching quality and stronger teacher care were generally associated with greater college preparedness, particularly among non-IDEA students. Among IDEA students, small sample sizes produced some inconsistent patterns. The overall trend suggests that positive teaching experiences and strong teacher relationships can contribute to student readiness for college.
Breadth of support services: Students who reported access to a broader range of support services generally reported higher preparedness and stronger time management confidence. This pattern was especially clear among non-IDEA students. Notably, some non-IDEA students reported no services at all, which may reflect either a true lack of services or a lack of student awareness. While IDEA students generally reported strong access to services, one student’s open-ended response suggested that the quality and depth of those services may vary across campuses.
These findings can help inform future improvements in curriculum design, extracurricular offerings, family engagement strategies, and support for advanced coursework.
5 Detailed Results
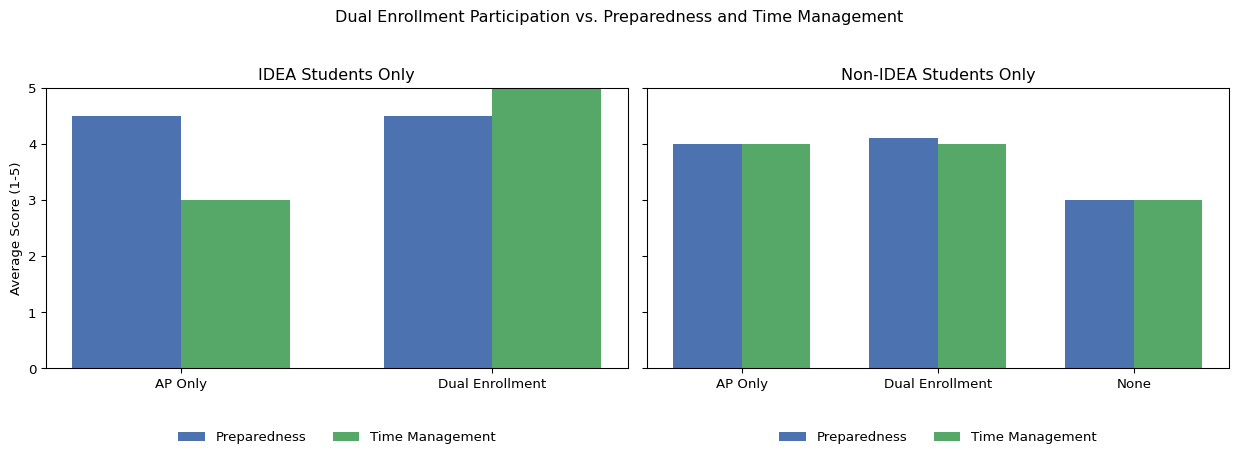
5.1 Dual Enrollment participation
We examined whether participating in dual enrollment or AP courses in high school was associated with two outcomes: students’ college preparedness and their confidence in managing time and responsibilities during their first semester of college. Among IDEA students, those who participated in dual enrollment reported the highest possible scores for both preparedness and time management, while those who took only AP courses reported high preparedness but average confidence in time management. No IDEA students reported not participating in any advanced courses, so this group could not be analyzed. For non-IDEA students, those who took dual enrollment or AP courses had higher average preparedness and time management scores than those who took no advanced courses. These results suggest that dual enrollment and AP participation are linked with feeling more prepared for college and better equipped to manage time.
Notably, only two students in the entire sample rated themselves as “not at all” prepared or confident in managing time, and both were non-IDEA students. The student who did not take any advanced courses wrote, “Not at all, they only offered help for mechanical engineering majors.” The other, who took dual enrollment, stated, “Nope not at all. I wish I had never gotten credits from high school.” These outlier responses highlight that individual experiences, such as limited course offerings or a mismatch between high school courses and a student’s intended college major, can strongly influence perceptions of readiness regardless of participation in advanced coursework.
Code
import pandas as pdimport numpy as npimport matplotlib.pyplot as plt# Load your data (adjust path if needed)df = pd.read_csv("College Readiness and Educational Experience Survey.csv")# Prep columns and mappingsde_col ="Did you take any college level courses during high school?"q4 ="On a scale of 1 to 5, how prepared did you feel for college-level coursework when you started?\n(1 means not prepared at all, 5 means extremely well prepared)\n "idea_col ="Did you attend an IDEA Public School?"q9 = [c for c in df.columns if"How confident were you in managing your own time"in c][0]df["IDEA"] = df[idea_col].map({"Yes": "IDEA", "No": "Non-IDEA"})tm_map = {"Very confident": 5,"Somewhat confident": 4,"Neutral": 3,"Not very confident": 2,"Not at all confident": 1}df["TimeManagement"] = df[q9].map(tm_map)df["Preparedness"] = pd.to_numeric(df[q4], errors="coerce")# Dual enrollment groupsdef group_de(row): r =str(row).lower()if"dual enrollment"in r or"early college"in r:return"Dual Enrollment"elif"ap"in r:return"AP Only"elif"no"in r:return"None"else:returnNonedf["DE_Group"] = df[de_col].apply(group_de)de_labels = ["AP Only", "Dual Enrollment", "None"]# Helper for group means by DE statusdef de_stats(df, group): subset = df[(df["IDEA"] == group) & df["DE_Group"].notna() & df["Preparedness"].notna() & df["TimeManagement"].notna()] means_p = subset.groupby("DE_Group")["Preparedness"].mean().reindex(de_labels) means_tm = subset.groupby("DE_Group")["TimeManagement"].mean().reindex(de_labels)return means_p, means_tmmeans_idea, means_idea_tm = de_stats(df, "IDEA")means_nonidea, means_nonidea_tm = de_stats(df, "Non-IDEA")def bar_data(m1, m2): mask = m1.notna() | m2.notna()return m1[mask], m2[mask], [l for l, k inzip(de_labels, mask) if k]prep_idea, tm_idea, labels_idea = bar_data(means_idea, means_idea_tm)prep_nonidea, tm_nonidea, labels_nonidea = bar_data(means_nonidea, means_nonidea_tm)width =0.35fig, axes = plt.subplots(1, 2, figsize=(13,5), sharey=True)# IDEA chartx_idea = np.arange(len(labels_idea))axes[0].bar(x_idea - width/2, prep_idea, width, label='Preparedness', color='#4C72B0')axes[0].bar(x_idea + width/2, tm_idea, width, label='Time Management', color='#55A868')axes[0].set_xticks(x_idea)axes[0].set_xticklabels(labels_idea)axes[0].set_ylim(0, 5)axes[0].set_ylabel("Average Score (1-5)")axes[0].set_title("IDEA Students Only")axes[0].legend(loc='upper center', bbox_to_anchor=(0.5, -0.18), ncol=2, frameon=False)# Non-IDEA chartx_nonidea = np.arange(len(labels_nonidea))axes[1].bar(x_nonidea - width/2, prep_nonidea, width, label='Preparedness', color='#4C72B0')axes[1].bar(x_nonidea + width/2, tm_nonidea, width, label='Time Management', color='#55A868')axes[1].set_xticks(x_nonidea)axes[1].set_xticklabels(labels_nonidea)axes[1].set_ylim(0, 5)axes[1].set_title("Non-IDEA Students Only")axes[1].legend(loc='upper center', bbox_to_anchor=(0.5, -0.18), ncol=2, frameon=False)plt.suptitle("Dual Enrollment Participation vs. Preparedness and Time Management")plt.tight_layout(rect=[0, 0, 1, 0.95])plt.show()# Outlier detection for Dual Enrollment Impacts (Q4 and Q9)q15_col = [c for c in df.columns if"Do you feel your high school prepared you for the major"in c][0]outliers = df[ ( (df["Preparedness"] ==1) | (df["TimeManagement"] ==1) ) & df["DE_Group"].notna()]outliers_summary = outliers[["IDEA", "DE_Group", "Preparedness", "TimeManagement", q15_col]]
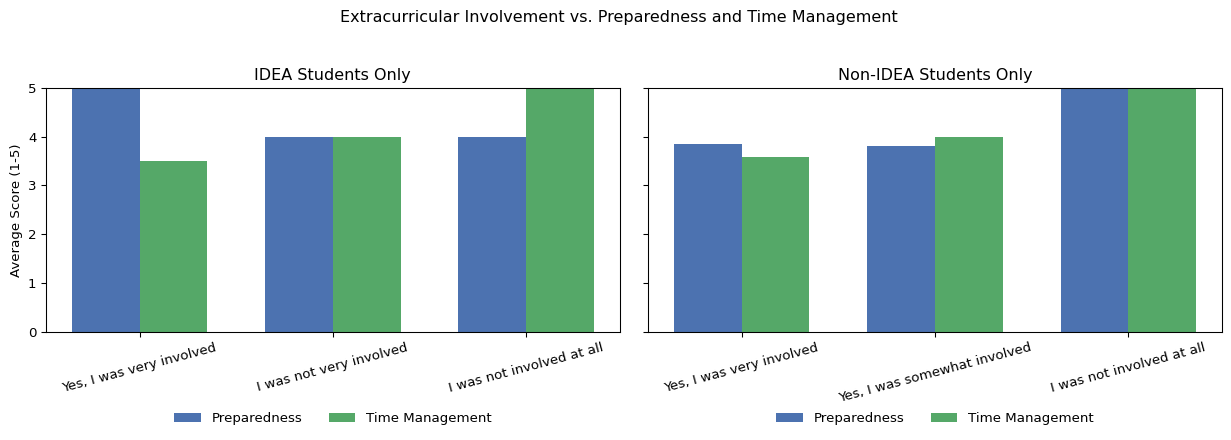
5.2 Extracurricular involvement
We examined whether students’ involvement in extracurricular activities during high school was associated with their self-reported college preparedness and time management confidence. Among IDEA students, those who reported being very involved in extracurriculars felt the most prepared for college, with an average preparedness score of 5.0 and a time management score of 3.5. IDEA students who were not very involved still reported a high average preparedness of 4.0 and time management of 4.0. For non-IDEA students, those who were very involved in extracurriculars had an average preparedness score of 3.86 and a time management score of 3.57, while those who were somewhat involved had similar averages (3.8 for preparedness and 4.0 for time management). Interestingly, the few non-IDEA students who were not involved at all reported the highest possible scores (5.0) for both preparedness and time management, though this result is based on a very small number of responses.
Notably, two outliers were observed among non-IDEA students. One student who was very involved in extracurriculars reported feeling not at all prepared for college and not at all confident in managing time, writing, “Not at all, they only offered help for mechanical engineering majors.” Another student who was somewhat involved in extracurriculars gave the lowest possible preparedness rating but reported high time management confidence, commenting, “Nope not at all. I wish I had never gotten credits from high school.” These outlier responses suggest that, despite overall trends, individual perceptions of readiness can be shaped by factors such as limited high school support for certain career paths or dissatisfaction with advanced course credits.
Code
import pandas as pdimport numpy as npimport matplotlib.pyplot as plt# Load data (adjust path if needed)df = pd.read_csv("College Readiness and Educational Experience Survey.csv")# Prepare columns and mappingsq4 ="On a scale of 1 to 5, how prepared did you feel for college-level coursework when you started?\n(1 means not prepared at all, 5 means extremely well prepared)\n "q8 ="Were you involved in extracurricular activities during high school?"q9 = [c for c in df.columns if"How confident were you in managing your own time"in c][0]idea_col ="Did you attend an IDEA Public School?"df["IDEA"] = df[idea_col].map({"Yes": "IDEA", "No": "Non-IDEA"})tm_map = {"Very confident": 5,"Somewhat confident": 4,"Neutral": 3,"Not very confident": 2,"Not at all confident": 1}df["TimeManagement"] = df[q9].map(tm_map)df["Preparedness"] = pd.to_numeric(df[q4], errors="coerce")xtra_labels = ["Yes, I was very involved","Yes, I was somewhat involved","I was not very involved","I was not involved at all"]# Function to prep group stats for each subgroupdef extra_stats(df, group): subset = df[(df["IDEA"] == group) & df["Preparedness"].notna() & df["TimeManagement"].notna() & df[q8].notna()] means_p = subset.groupby(q8)["Preparedness"].mean().reindex(xtra_labels) means_tm = subset.groupby(q8)["TimeManagement"].mean().reindex(xtra_labels)return means_p, means_tmmeans_p_idea, means_tm_idea = extra_stats(df, "IDEA")means_p_nonidea, means_tm_nonidea = extra_stats(df, "Non-IDEA")# Prepare chart data (drop NaNs)def bar_data(m1, m2): mask = m1.notna() | m2.notna()return m1[mask], m2[mask], [l for l, k inzip(xtra_labels, mask) if k]prep_idea, tm_idea, labels_idea = bar_data(means_p_idea, means_tm_idea)prep_nonidea, tm_nonidea, labels_nonidea = bar_data(means_p_nonidea, means_tm_nonidea)width =0.35fig, axes = plt.subplots(1, 2, figsize=(13,5), sharey=True)# IDEA Studentsx_idea = np.arange(len(labels_idea))axes[0].bar(x_idea - width/2, prep_idea, width, label='Preparedness', color='#4C72B0')axes[0].bar(x_idea + width/2, tm_idea, width, label='Time Management', color='#55A868')axes[0].set_xticks(x_idea)axes[0].set_xticklabels(labels_idea, rotation=15)axes[0].set_ylim(0, 5)axes[0].set_ylabel("Average Score (1-5)")axes[0].set_title("IDEA Students Only")axes[0].legend(loc='upper center', bbox_to_anchor=(0.5, -0.28), ncol=2, frameon=False)# Non-IDEA Studentsx_nonidea = np.arange(len(labels_nonidea))axes[1].bar(x_nonidea - width/2, prep_nonidea, width, label='Preparedness', color='#4C72B0')axes[1].bar(x_nonidea + width/2, tm_nonidea, width, label='Time Management', color='#55A868')axes[1].set_xticks(x_nonidea)axes[1].set_xticklabels(labels_nonidea, rotation=15)axes[1].set_ylim(0, 5)axes[1].set_title("Non-IDEA Students Only")axes[1].legend(loc='upper center', bbox_to_anchor=(0.5, -0.28), ncol=2, frameon=False)plt.suptitle("Extracurricular Involvement vs. Preparedness and Time Management")plt.tight_layout(rect=[0, 0, 1, 0.95])plt.show()# Outlier detection for Extracurricular Impacts (Q4 and Q9)q15_col = [c for c in df.columns if"Do you feel your high school prepared you for the major"in c][0]outliers = df[ ( (df["Preparedness"] ==1) | (df["TimeManagement"] ==1) ) & df[q8].notna()]outliers_summary = outliers[["IDEA", q8, "Preparedness", "TimeManagement", q15_col]]
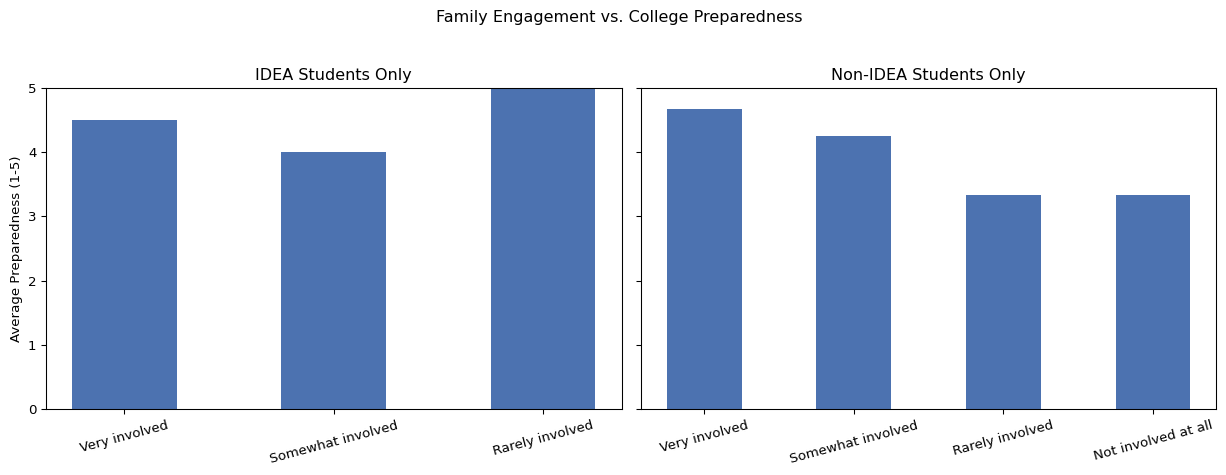
5.3 Family engagement
We examined whether students who felt their families were more involved in their academic progress during high school reported higher levels of college preparedness. Among IDEA students, the small number of responses meant that not all categories were represented. Of the available responses, those who described their families as “rarely involved” reported a higher average preparedness score than those who described their families as “very involved.” For non-IDEA students, the more typical pattern emerged: students who reported “very involved” or “somewhat involved” families tended to feel more prepared for college compared to those who reported their families were “rarely involved” or “not involved at all.”
Reviewing for outliers, one non-IDEA student with a preparedness score of 1 indicated that their family was “very involved.” In their open-ended response, they wrote, “Not at all, they only offered help for mechanical engineering majors.” Another non-IDEA outlier who rated their family as “rarely involved” also gave a preparedness score of 1, writing, “Nope not at all. I wish I had never gotten credits from high school.” These responses suggest that, even with strong or weak family involvement, students may feel unprepared if school support or guidance does not align with their intended field or interests.
Code
import pandas as pdimport numpy as npimport matplotlib.pyplot as plt# Load your data (adjust path if needed)df = pd.read_csv("College Readiness and Educational Experience Survey.csv")# Prep columnsq4 ="On a scale of 1 to 5, how prepared did you feel for college-level coursework when you started?\n(1 means not prepared at all, 5 means extremely well prepared)\n "q12 ="Did your family feel involved or informed about your academic progress during high school?"idea_col ="Did you attend an IDEA Public School?"df["IDEA"] = df[idea_col].map({"Yes": "IDEA", "No": "Non-IDEA"})df["Preparedness"] = pd.to_numeric(df[q4], errors="coerce")family_labels = ["Very involved","Somewhat involved","Rarely involved","Not involved at all","Not sure"]def fam_stats(df, group): subset = df[(df["IDEA"] == group) & df["Preparedness"].notna() & df[q12].notna()] means_p = subset.groupby(q12)["Preparedness"].mean().reindex(family_labels)return means_pmeans_idea = fam_stats(df, "IDEA")means_nonidea = fam_stats(df, "Non-IDEA")def bar_data(m): mask = m.notna()return m[mask], [l for l, k inzip(family_labels, mask) if k]prep_idea, labels_idea = bar_data(means_idea)prep_nonidea, labels_nonidea = bar_data(means_nonidea)width =0.5fig, axes = plt.subplots(1, 2, figsize=(13,5), sharey=True)# IDEA chartx_idea = np.arange(len(labels_idea))axes[0].bar(x_idea, prep_idea, width, color='#4C72B0')axes[0].set_xticks(x_idea)axes[0].set_xticklabels(labels_idea, rotation=15)axes[0].set_ylim(0, 5)axes[0].set_ylabel("Average Preparedness (1-5)")axes[0].set_title("IDEA Students Only")# Non-IDEA chartx_nonidea = np.arange(len(labels_nonidea))axes[1].bar(x_nonidea, prep_nonidea, width, color='#4C72B0')axes[1].set_xticks(x_nonidea)axes[1].set_xticklabels(labels_nonidea, rotation=15)axes[1].set_ylim(0, 5)axes[1].set_title("Non-IDEA Students Only")plt.suptitle("Family Engagement vs. College Preparedness")plt.tight_layout(rect=[0, 0, 1, 0.95])plt.show()# Outlier detection: preparedness = 1outliers = df[(df["Preparedness"] ==1) & df[q12].notna()]q15_col = [c for c in df.columns if"Do you feel your high school prepared you for the major"in c][0]outliers_summary = outliers[["IDEA", q12, "Preparedness", q15_col]]
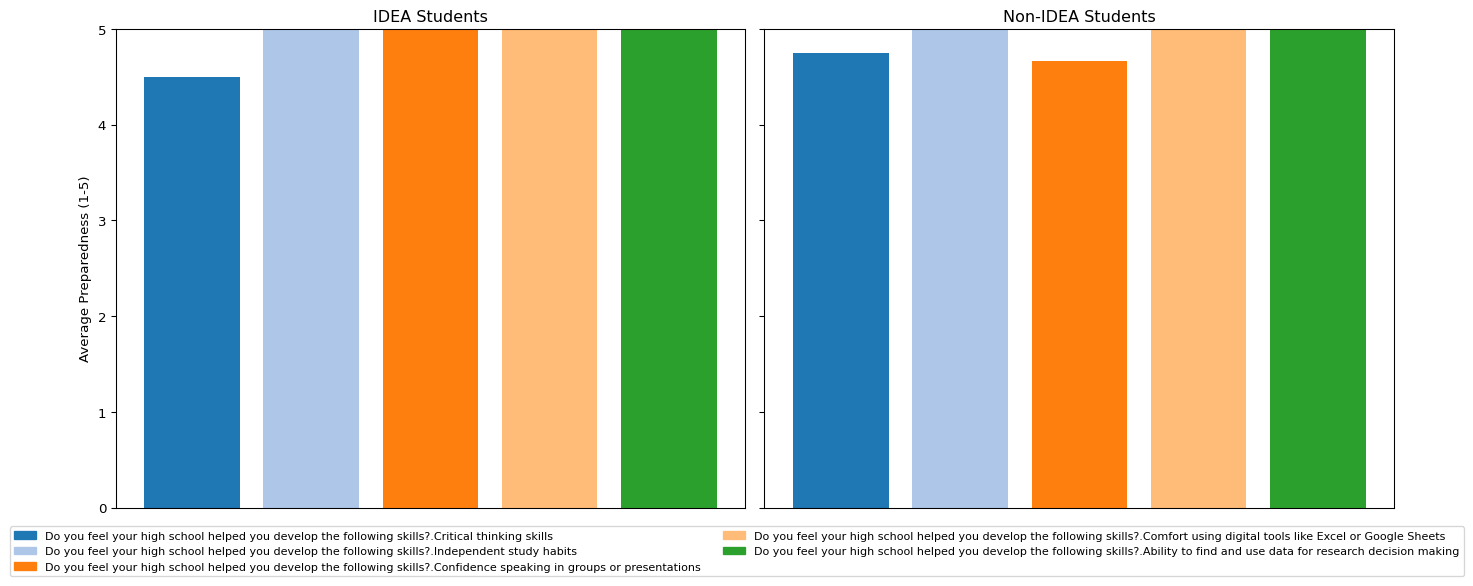
5.4 Skills development
We examined whether students who felt their high school helped them develop specific academic skills reported higher levels of college preparedness. Among IDEA students, all of those who selected “Strongly agree” for the available skills also reported the highest possible preparedness rating of 5. This resulted in average preparedness scores of 5 across all skills for IDEA students in the chart. For non-IDEA students, the pattern was similar: students who selected “Strongly agree” generally reported high levels of preparedness, though with more variation across skills.
Reviewing for outliers, one IDEA student with a preparedness score of 5 selected “Strongly disagree” for multiple skills, including “Independent study habits,” “Confidence speaking in groups or presentations,” “Comfort using digital tools like Excel or Google Sheets,” and “Ability to find and use data for research decision making.” In their open-ended response, they wrote, “No because my school offered AP courses that did not transfer into my degree. So I took those classes for nothing and it was very upsetting. I was in the top 10% of my class, yet earned little to no college credit. My school only encouraged us to apply to college outside of TX rather than an affordable option like UTRGV.”
Another Non-IDEA student with a preparedness score of 5 selected “Strongly disagree” for “Critical thinking skills” and “Independent study habits.” In their open-ended response, they wrote, “I was originally in the medical field, BUT too many math classes were required for my program. I had to switch to education because I had taken so many education classes for my AP certification.” These responses suggest that, even when students feel that specific academic skills were not strongly developed in high school, they may still perceive themselves as well prepared for college, depending on their individual pathways and experiences.
Code
import pandas as pdimport numpy as npimport matplotlib.pyplot as plt# Load datasetdf = pd.read_csv("College Readiness and Educational Experience Survey.csv")# Identify relevant columnsq4 ="On a scale of 1 to 5, how prepared did you feel for college-level coursework when you started?\n(1 means not prepared at all, 5 means extremely well prepared)\n "idea_col ="Did you attend an IDEA Public School?"# Find Q10 skill columnsq10_cols = [col for col in df.columns if"Do you feel your high school helped you develop"in col]# Prep IDEA and Preparedness columnsdf["IDEA"] = df[idea_col].map({"Yes": "IDEA", "No": "Non-IDEA"})df["Preparedness"] = pd.to_numeric(df[q4], errors="coerce")# Function to compute mean preparedness for Strongly agree responses (with text cleanup)def compute_strongly_agree_means(df, group): means = []for skill_col in q10_cols: subset = df[ (df["IDEA"] == group) & (df["Preparedness"].notna()) & (df[skill_col].str.strip().str.lower() =="strongly agree") ] mean_prep = subset["Preparedness"].mean() means.append(mean_prep)return means# Compute meansmeans_idea = compute_strongly_agree_means(df, "IDEA")means_nonidea = compute_strongly_agree_means(df, "Non-IDEA")# Plot clean horizontal bar chartsfig, axes = plt.subplots(1, 2, figsize=(14, 6), sharey=True)# Assign colors to skillscolors = plt.cm.tab20.colors[:len(q10_cols)]# IDEA plotx_pos = np.arange(len(q10_cols))axes[0].bar(x_pos, means_idea, color=colors)axes[0].set_xticks([])axes[0].set_ylim(0, 5)axes[0].set_ylabel("Average Preparedness (1-5)")axes[0].set_title("IDEA Students")# Non-IDEA plotaxes[1].bar(x_pos, means_nonidea, color=colors)axes[1].set_xticks([])axes[1].set_ylim(0, 5)axes[1].set_title("Non-IDEA Students")# Add legendhandles = [plt.Rectangle((0,0),1,1, color=colors[i]) for i inrange(len(q10_cols))]fig.legend(handles, q10_cols, loc='lower center', bbox_to_anchor=(0.5, -0.02), ncol=2, fontsize='small')plt.tight_layout(rect=[0, 0.07, 1, 1])plt.show()# Outlier detection: Strongly agree + Prep=1 OR Strongly disagree + Prep=5q15_col = [c for c in df.columns if"Do you feel your high school prepared you for the major"in c][0]outlier_rows = []for skill_col in q10_cols: outliers = df[ ((df[skill_col].str.strip().str.lower() =="strongly agree") & (df["Preparedness"] ==1)) | ((df[skill_col].str.strip().str.lower() =="strongly disagree") & (df["Preparedness"] ==5)) ]ifnot outliers.empty: temp = outliers[["IDEA", skill_col, "Preparedness", q15_col]].copy() outlier_rows.append(temp)# Combine all outliers into one dataframeif outlier_rows: outliers_summary = pd.concat(outlier_rows, ignore_index=True)else: outliers_summary = pd.DataFrame(columns=["IDEA", skill_col, "Preparedness", q15_col])
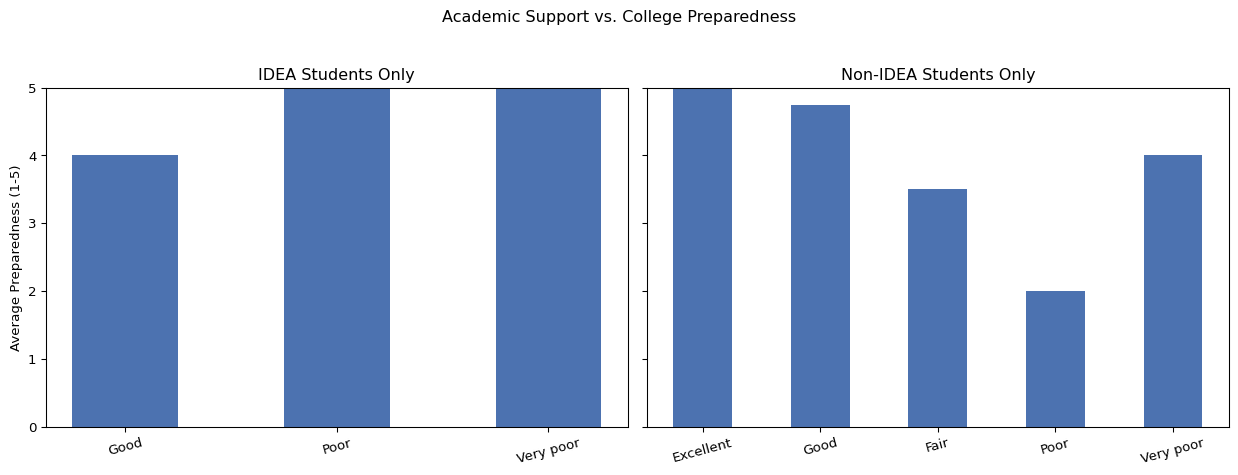
5.5 Academic Support
We examined whether students who felt they received stronger academic support in high school reported higher levels of college preparedness. Among IDEA students, the small number of responses meant that not all categories were represented. Of the available responses, those who rated their academic support as “Poor” or “Very poor” reported higher average preparedness scores than those who rated their support as “Good.” This unexpected pattern is likely due to the small sample size of IDEA students in this category. For non-IDEA students, the more typical pattern was observed: students who rated their academic support more positively tended to report higher levels of preparedness.
Reviewing for outliers, one IDEA student with a preparedness score of 5 rated their academic support as “Very poor.” In their open-ended response, they wrote, “Yes, I am majoring in Criminal Justice. As a first-generation college student, I have struggled finding scholarships, guidance, and financial advice from my high school. I have had to learn everything on my own.” This suggests that, in some cases, students may feel academically prepared for college despite perceiving major gaps in the academic support they received during high school.
Code
import pandas as pdimport numpy as npimport matplotlib.pyplot as plt# Load datasetdf = pd.read_csv("College Readiness and Educational Experience Survey.csv")# Identify relevant columnsq4 ="On a scale of 1 to 5, how prepared did you feel for college-level coursework when you started?\n(1 means not prepared at all, 5 means extremely well prepared)\n "q5 ="How would you rate the quality of academic support you received in high school?"idea_col ="Did you attend an IDEA Public School?"# Prep IDEA and Preparedness columnsdf["IDEA"] = df[idea_col].map({"Yes": "IDEA", "No": "Non-IDEA"})df["Preparedness"] = pd.to_numeric(df[q4], errors="coerce")# Define the correct order of responsessupport_labels = ["Excellent","Good","Fair","Poor","Very poor"]# Function to compute mean preparedness by academic support leveldef support_stats(df, group): subset = df[(df["IDEA"] == group) & df["Preparedness"].notna() & df[q5].notna()] means_p = subset.groupby(q5)["Preparedness"].mean().reindex(support_labels)return means_p# Compute means for IDEA and Non-IDEAmeans_idea = support_stats(df, "IDEA")means_nonidea = support_stats(df, "Non-IDEA")# Prepare bar datadef bar_data(m): mask = m.notna()return m[mask], [l for l, k inzip(support_labels, mask) if k]prep_idea, labels_idea = bar_data(means_idea)prep_nonidea, labels_nonidea = bar_data(means_nonidea)# Plot side-by-side bar chartswidth =0.5fig, axes = plt.subplots(1, 2, figsize=(13, 5), sharey=True)# IDEA chartx_idea = np.arange(len(labels_idea))axes[0].bar(x_idea, prep_idea, width, color='#4C72B0')axes[0].set_xticks(x_idea)axes[0].set_xticklabels(labels_idea, rotation=15)axes[0].set_ylim(0, 5)axes[0].set_ylabel("Average Preparedness (1-5)")axes[0].set_title("IDEA Students Only")# Non-IDEA chartx_nonidea = np.arange(len(labels_nonidea))axes[1].bar(x_nonidea, prep_nonidea, width, color='#4C72B0')axes[1].set_xticks(x_nonidea)axes[1].set_xticklabels(labels_nonidea, rotation=15)axes[1].set_ylim(0, 5)axes[1].set_title("Non-IDEA Students Only")plt.suptitle("Academic Support vs. College Preparedness")plt.tight_layout(rect=[0, 0, 1, 0.95])plt.show()# Outlier detection: "Excellent" + Prep=1 and "Poor" + Prep=5q15_col = [c for c in df.columns if"Do you feel your high school prepared you for the major"in c][0]outliers = df[ ((df[q5].str.strip().str.lower() =="excellent") & (df["Preparedness"] ==1)) | ((df[q5].str.strip().str.lower() =="very poor") & (df["Preparedness"] ==5))]ifnot outliers.empty: outliers_summary = outliers[["IDEA", q5, "Preparedness", q15_col]]else: outliers_summary = pd.DataFrame(columns=["IDEA", q5, "Preparedness", q15_col])
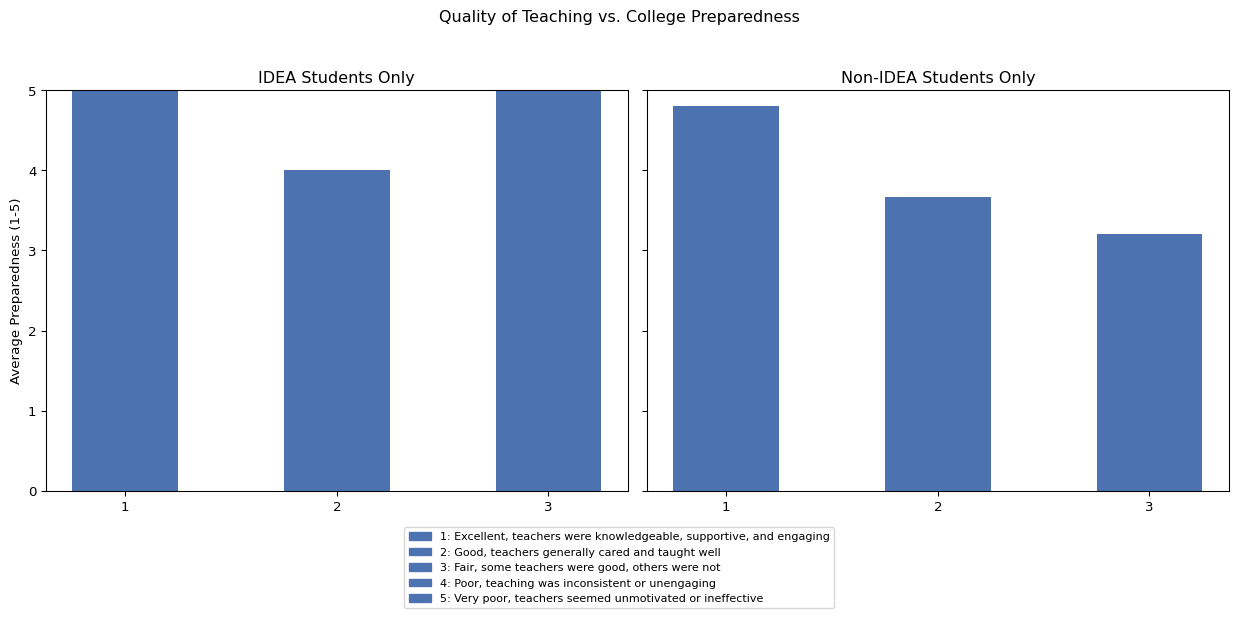
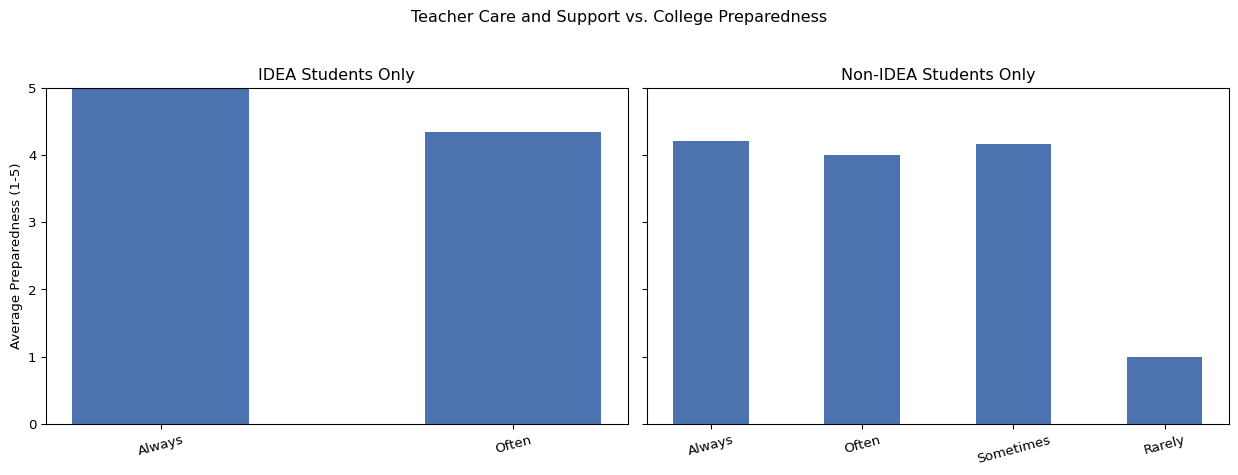
5.6 Quality of teaching and teaching care
We examined whether students who felt they experienced higher quality teaching or stronger teacher support in high school reported higher levels of college preparedness. Among IDEA students, responses for teaching quality were limited, and not all categories were represented. Of the available responses, students who rated teaching quality as “Fair” reported higher average preparedness scores than those who rated it as “Good,” a pattern likely influenced by the small number of responses in each category. Among non-IDEA students, a more typical pattern was observed: students who rated teaching quality more positively tended to report higher preparedness.
For teacher care, IDEA students again provided a limited range of responses, with most selecting either “Always” or “Often.” Those who selected “Always” reported higher average preparedness than those who selected “Often.” Among non-IDEA students, responses spanned a wider range. While preparedness generally aligned with reported levels of teacher care, there were some inconsistencies across the mid-range categories, which may reflect variation in student experiences or small sample sizes.
No outliers were detected for either measure in this analysis.
Code
import pandas as pdimport numpy as npimport matplotlib.pyplot as plt# Load datasetdf = pd.read_csv("College Readiness and Educational Experience Survey.csv")# Identify relevant columnsq4 ="On a scale of 1 to 5, how prepared did you feel for college-level coursework when you started?\n(1 means not prepared at all, 5 means extremely well prepared)\n "q13 ="How would you describe the quality of teaching you experienced at your high school?"q14 ="Did you feel your teachers genuinely cared about your success beyond academics?"idea_col ="Did you attend an IDEA Public School?"# Prep IDEA and Preparedness columnsdf["IDEA"] = df[idea_col].map({"Yes": "IDEA", "No": "Non-IDEA"})df["Preparedness"] = pd.to_numeric(df[q4], errors="coerce")# Define correct order of responses for Q13q13_labels = ["Excellent, teachers were knowledgeable, supportive, and engaging","Good, teachers generally cared and taught well","Fair, some teachers were good, others were not","Poor, teaching was inconsistent or unengaging","Very poor, teachers seemed unmotivated or ineffective"]# Define correct order of responses for Q14q14_labels = ["Always","Often","Sometimes","Rarely","Never"]# Function to compute mean preparedness for any questiondef compute_means(df, group, question_col, labels): subset = df[(df["IDEA"] == group) & df["Preparedness"].notna() & df[question_col].notna()] means_p = subset.groupby(question_col)["Preparedness"].mean().reindex(labels)return means_p# Function to prepare bar datadef bar_data(m, labels): mask = m.notna()return m[mask], [l for l, k inzip(labels, mask) if k]# Plot function for Q13 (with LEGEND instead of long labels)def plot_q13_with_legend(question_col, labels, title_suffix): means_idea = compute_means(df, "IDEA", question_col, labels) means_nonidea = compute_means(df, "Non-IDEA", question_col, labels) prep_idea, labels_idea = bar_data(means_idea, labels) prep_nonidea, labels_nonidea = bar_data(means_nonidea, labels)# Plot width =0.5 fig, axes = plt.subplots(1, 2, figsize=(13, 6), sharey=True)# IDEA chart x_idea = np.arange(len(labels_idea)) axes[0].bar(x_idea, prep_idea, width, color='#4C72B0') axes[0].set_xticks(x_idea) axes[0].set_xticklabels([str(i+1) for i inrange(len(labels_idea))]) axes[0].set_ylim(0, 5) axes[0].set_ylabel("Average Preparedness (1-5)") axes[0].set_title("IDEA Students Only")# Non-IDEA chart x_nonidea = np.arange(len(labels_nonidea)) axes[1].bar(x_nonidea, prep_nonidea, width, color='#4C72B0') axes[1].set_xticks(x_nonidea) axes[1].set_xticklabels([str(i+1) for i inrange(len(labels_nonidea))]) axes[1].set_ylim(0, 5) axes[1].set_title("Non-IDEA Students Only") plt.suptitle(f"{title_suffix} vs. College Preparedness") plt.tight_layout(rect=[0, 0.08, 1, 0.95])# Add LEGEND below handles = [plt.Rectangle((0,0),1,1, color='#4C72B0')] *len(labels) fig.legend(handles, [f"{i+1}: {label}"for i, label inenumerate(labels)], loc='lower center', bbox_to_anchor=(0.5, -0.07), ncol=1, fontsize='small') plt.show()# Plot function for Q14 (standard labels)def plot_q14_standard(question_col, labels, title_suffix): means_idea = compute_means(df, "IDEA", question_col, labels) means_nonidea = compute_means(df, "Non-IDEA", question_col, labels) prep_idea, labels_idea = bar_data(means_idea, labels) prep_nonidea, labels_nonidea = bar_data(means_nonidea, labels)# Plot width =0.5 fig, axes = plt.subplots(1, 2, figsize=(13, 5), sharey=True)# IDEA chart x_idea = np.arange(len(labels_idea)) axes[0].bar(x_idea, prep_idea, width, color='#4C72B0') axes[0].set_xticks(x_idea) axes[0].set_xticklabels(labels_idea, rotation=15) axes[0].set_ylim(0, 5) axes[0].set_ylabel("Average Preparedness (1-5)") axes[0].set_title("IDEA Students Only")# Non-IDEA chart x_nonidea = np.arange(len(labels_nonidea)) axes[1].bar(x_nonidea, prep_nonidea, width, color='#4C72B0') axes[1].set_xticks(x_nonidea) axes[1].set_xticklabels(labels_nonidea, rotation=15) axes[1].set_ylim(0, 5) axes[1].set_title("Non-IDEA Students Only") plt.suptitle(f"{title_suffix} vs. College Preparedness") plt.tight_layout(rect=[0, 0, 1, 0.95]) plt.show()# ---- Plot Q13 with LEGEND ----plot_q13_with_legend(q13, q13_labels, "Quality of Teaching")# ---- Plot Q14 standard ----plot_q14_standard(q14, q14_labels, "Teacher Care and Support")# ---- Outlier detection for Q13 ----q15_col = [c for c in df.columns if"Do you feel your high school prepared you for the major"in c][0]outliers_q13 = df[ ((df[q13].str.strip().str.lower() =="excellent, teachers were knowledgeable, supportive, and engaging") & (df["Preparedness"] ==1)) | ((df[q13].str.strip().str.lower() =="very poor, teachers seemed unmotivated or ineffective") & (df["Preparedness"] ==5))]ifnot outliers_q13.empty: outliers_summary_q13 = outliers_q13[["IDEA", q13, "Preparedness", q15_col]]else: outliers_summary_q13 = pd.DataFrame(columns=["IDEA", q13, "Preparedness", q15_col])# ---- Outlier detection for Q14 ----outliers_q14 = df[ ((df[q14].str.strip().str.lower() =="always") & (df["Preparedness"] ==1)) | ((df[q14].str.strip().str.lower() =="never") & (df["Preparedness"] ==5))]ifnot outliers_q14.empty: outliers_summary_q14 = outliers_q14[["IDEA", q14, "Preparedness", q15_col]]else: outliers_summary_q14 = pd.DataFrame(columns=["IDEA", q14, "Preparedness", q15_col])
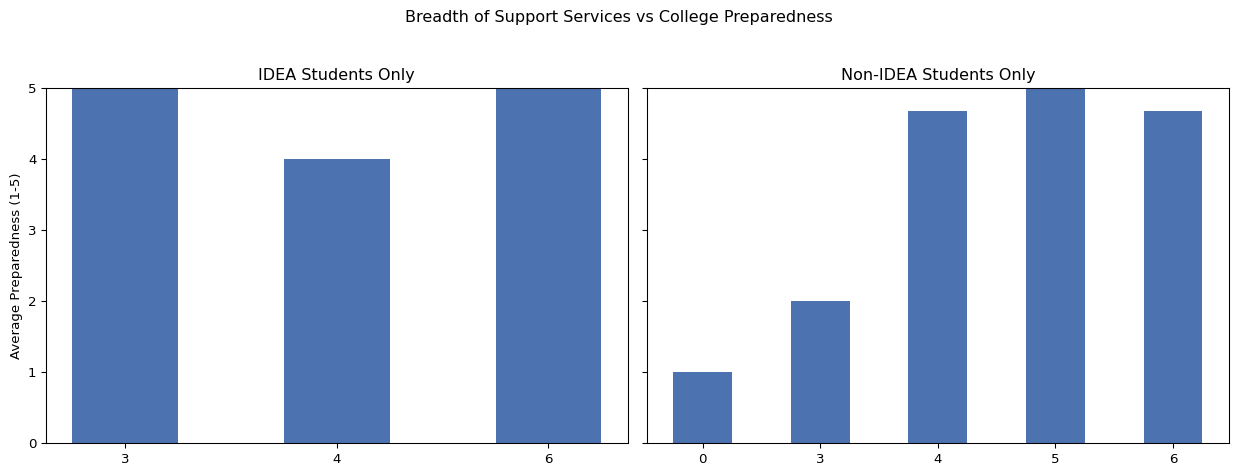
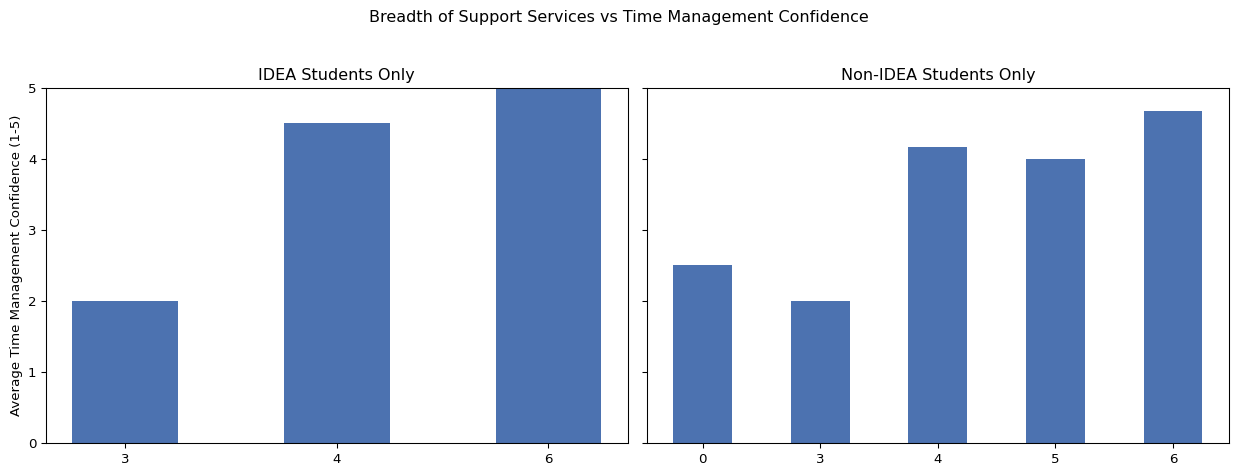
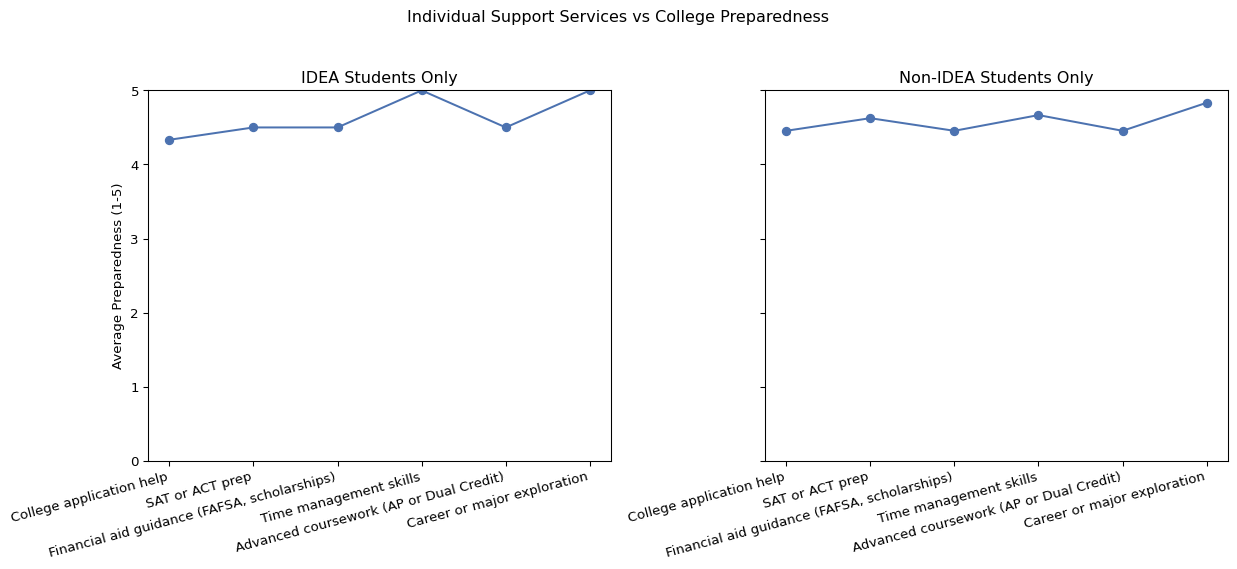
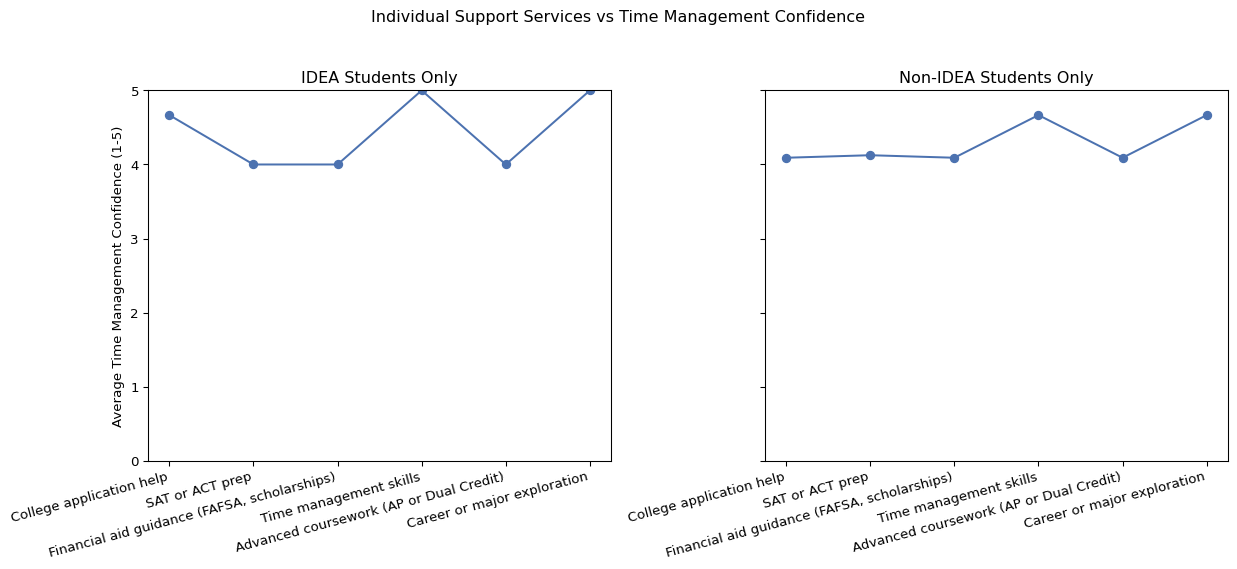
5.7 Breadth of support services
We examined whether access to a broader range of support services in high school was associated with higher levels of college preparedness and greater confidence in time management. Among IDEA students, those who reported access to more services tended to report higher preparedness and time management confidence. However, the relatively small number of responses at some levels of service breadth may contribute to variation in these results. For non-IDEA students, a clearer trend emerged: students with access to more services reported progressively higher preparedness and time management confidence.
Interestingly, non-IDEA students were the only group in which some students reported that their school offered no services at all. This may reflect either an actual lack of services, or a lack of student awareness about services offered. As one non-IDEA student noted, it is not uncommon for students to be unaware of available resources at their school. However, IDEA students are not immune to this dynamic. One IDEA student selected all services when asked, but also wrote in their open-ended response: “Yes, I am majoring in Criminal Justice. As a freshman, students are required to take a business class. As a sophomore, students are required to take a computer science class. As a junior, students are required to take a nursing class. As a senior, we were required to take a principles of law class. We were able to deeply explore various fields of education and work.” This suggests that while many IDEA schools offer a wide range of supports, the depth and quality of those supports may vary across campuses.
When examining individual services, the overall trends for IDEA and non-IDEA students were relatively similar. In both groups, certain services such as Time management skills and Career or major exploration were associated with somewhat higher average preparedness and time management confidence. No outliers were detected in this analysis.
Code
import pandas as pdimport numpy as npimport matplotlib as mplimport matplotlib.pyplot as plt# Load datasetdf = pd.read_csv("College Readiness and Educational Experience Survey.csv")# Identify columnsq4 ="On a scale of 1 to 5, how prepared did you feel for college-level coursework when you started?\n(1 means not prepared at all, 5 means extremely well prepared)\n "q9_col ="How confident were you in managing your own time and responsibilities during your first semester of college?"q6 ="Did your high school offer support in the following areas?\n(Select all that apply)\n "idea_col ="Did you attend an IDEA Public School?"# Prep IDEA and Preparednessdf["IDEA"] = df[idea_col].map({"Yes": "IDEA", "No": "Non-IDEA"})df["Preparedness"] = pd.to_numeric(df[q4], errors="coerce")# Map Q9 responses to 1–5 scaletime_mgmt_mapping = {"Very confident": 5,"Somewhat confident": 4,"Neutral": 3,"Not very confident": 2,"Not at all confident": 1}df["TimeManagement"] = df[q9_col].map(time_mgmt_mapping)# Q6: Services — exact wordingservices = ["College application help","SAT or ACT prep","Financial aid guidance (FAFSA, scholarships)","Time management skills","Advanced coursework (AP or Dual Credit)","Career or major exploration","None of the above"# will ignore this for individual service analysis]# ---- PART 1: Breadth of services ----# Correct function to count servicesdef count_services(row):if pd.isna(row[q6]):return0 selected_raw = [s.strip() for s in row[q6].split(";") if s.strip() !=""]# Fix buggy value selected = []for s in selected_raw:if s =="Financial aid guidance (FAFSA, scholarships": s ="Financial aid guidance (FAFSA, scholarships)" selected.append(s) count =sum([1for s in selected if s !="None of the above"])return countdf["ServicesCount"] = df.apply(count_services, axis=1)# Function to compute mean by # of servicesdef compute_breadth_means(df, group, outcome): subset = df[(df["IDEA"] == group) & df[outcome].notna()] means = subset.groupby("ServicesCount")[outcome].mean()return means# ---- Plot Breadth vs Outcome ----def plot_breadth(outcome_col, outcome_label, title_suffix): means_idea = compute_breadth_means(df, "IDEA", outcome_col) means_nonidea = compute_breadth_means(df, "Non-IDEA", outcome_col)# Plot width =0.5 fig, axes = plt.subplots(1, 2, figsize=(13, 5), sharey=True)# IDEA x_idea = np.arange(len(means_idea)) axes[0].bar(x_idea, means_idea.values, width, color='#4C72B0') axes[0].set_xticks(x_idea) axes[0].set_xticklabels(means_idea.index) axes[0].set_ylim(0, 5) axes[0].set_ylabel(outcome_label) axes[0].set_title("IDEA Students Only")# Non-IDEA x_nonidea = np.arange(len(means_nonidea)) axes[1].bar(x_nonidea, means_nonidea.values, width, color='#4C72B0') axes[1].set_xticks(x_nonidea) axes[1].set_xticklabels(means_nonidea.index) axes[1].set_ylim(0, 5) axes[1].set_title("Non-IDEA Students Only") plt.suptitle(f"Breadth of Support Services vs {title_suffix}") plt.tight_layout(rect=[0, 0, 1, 0.95]) plt.show()# ---- Plot Breadth Charts ----plot_breadth("Preparedness", "Average Preparedness (1-5)", "College Preparedness")plot_breadth("TimeManagement", "Average Time Management Confidence (1-5)", "Time Management Confidence")# ---- PART 2: Individual services ----# Correct function to flag individual servicesfor s in services: colname =f"ServiceSelected_{s}"def service_selected(row):if pd.isna(row[q6]):return0 selected_raw = [x.strip() for x in row[q6].split(";") if x.strip() !=""] selected = []for x in selected_raw:if x =="Financial aid guidance (FAFSA, scholarships": x ="Financial aid guidance (FAFSA, scholarships)" selected.append(x)return1if s in selected else0 df[colname] = df.apply(service_selected, axis=1)# Function to compute mean by servicedef compute_service_means(df, group, outcome): means = {}for s in services:if s =="None of the above":continue# skip for individual service analysis colname =f"ServiceSelected_{s}" subset = df[(df["IDEA"] == group) & df[outcome].notna()] mean_score = subset[subset[colname] ==1][outcome].mean() means[s] = mean_scorereturn means# ---- Plot Individual Services vs Outcome ----def plot_services(outcome_col, outcome_label, title_suffix): means_idea = compute_service_means(df, "IDEA", outcome_col) means_nonidea = compute_service_means(df, "Non-IDEA", outcome_col)# Plot fig, axes = plt.subplots(1, 2, figsize=(13, 6), sharey=True)# IDEA axes[0].scatter(range(len(means_idea)), list(means_idea.values()), color='#4C72B0') axes[0].plot(range(len(means_idea)), list(means_idea.values()), color='#4C72B0') axes[0].set_xticks(range(len(means_idea))) axes[0].set_xticklabels(list(means_idea.keys()), rotation=15, ha='right') axes[0].set_ylim(0, 5) axes[0].set_ylabel(outcome_label) axes[0].set_title("IDEA Students Only")# Non-IDEA axes[1].scatter(range(len(means_nonidea)), list(means_nonidea.values()), color='#4C72B0') axes[1].plot(range(len(means_nonidea)), list(means_nonidea.values()), color='#4C72B0') axes[1].set_xticks(range(len(means_nonidea))) axes[1].set_xticklabels(list(means_nonidea.keys()), rotation=15, ha='right') axes[1].set_ylim(0, 5) axes[1].set_title("Non-IDEA Students Only") plt.suptitle(f"Individual Support Services vs {title_suffix}") plt.tight_layout(rect=[0, 0, 1, 0.95]) plt.show()# ---- Plot Individual Services Charts ----plot_services("Preparedness", "Average Preparedness (1-5)", "College Preparedness")plot_services("TimeManagement", "Average Time Management Confidence (1-5)", "Time Management Confidence")# ---- Outlier detection (individual services only) ----q15_col = [c for c in df.columns if"Do you feel your high school prepared you for the major"in c][0]outlier_rows = []for s in services:if s =="None of the above":continue colname =f"ServiceSelected_{s}" service_outliers = df[ ((df[colname] ==1) & (df["Preparedness"] ==1)) | ((df[colname] ==1) & (df["TimeManagement"] ==1)) ]ifnot service_outliers.empty:for _, row in service_outliers.iterrows(): outlier_rows.append({"IDEA": row["IDEA"],"Service": s,"Preparedness": row["Preparedness"],"TimeManagement": row["TimeManagement"],"Q15_Response": row[q15_col] })# Create outliers summary dataframeif outlier_rows: outliers_summary_services = pd.DataFrame(outlier_rows)else: outliers_summary_services = pd.DataFrame(columns=["IDEA", "Service", "Preparedness", "TimeManagement", "Q15_Response"])
6 Conclusion and Recommendations
This survey analysis highlights several actionable insights for school and network leaders who want to strengthen college readiness outcomes. Many of the patterns align with expectations. For example, stronger skills development and broader access to support services are linked with higher preparedness. However, the findings also reveal important nuances and areas for further attention.
First, several results suggest that breadth of services alone is not sufficient. Quality, alignment, and communication about supports also matter. Even students with access to many services sometimes reported low preparedness, while others who perceived limited support still felt ready. This underscores the importance of making sure that services are both high-quality and well-matched to students’ academic and career pathways. It is also important to ensure that students are clearly informed about what is available.
Second, outlier responses and open-ended comments consistently pointed to the role of career alignment and credit applicability in shaping preparedness. Students expressed frustration when coursework or supports did not match their intended fields or when earned credits failed to transfer. This suggests a need to more intentionally align high school experiences, especially advanced coursework and advising, with students’ postsecondary goals.
Third, the results highlight opportunities to strengthen teacher-student relationships and communication about support services. This is especially important in non-IDEA contexts where awareness gaps were evident. IDEA leaders should also consider monitoring variation across campuses, as responses indicated that quality and depth of supports may not be consistent across the network.
In summary, while the survey results affirm the value of strong academic skills, extracurricular involvement, quality teaching, and robust support services, they also point to key areas where greater alignment, consistency, and communication could further strengthen college readiness outcomes.
7 Reflections and Next Steps
This survey provided useful insights into how students perceive their college readiness and which high school experiences they view as most helpful. At the same time, several limitations should be kept in mind.
First, some subgroups had small sample sizes, especially among IDEA students in certain categories. This means that a few patterns in the charts may reflect individual variation rather than broader trends. Increasing participation across campuses would help strengthen future analyses.
Second, because this is a self-reported survey, student perceptions do not always align with actual academic outcomes. Some students may feel prepared but struggle in college, while others may feel unprepared but succeed. It would be valuable to compare these survey results with data on first-year college performance to better understand how perceptions relate to outcomes.
Finally, this analysis raised new questions that could guide future work. For example, how do combinations of supports (such as dual enrollment with strong advising) influence readiness? How consistently are services implemented across campuses? What factors help students translate available supports into meaningful preparation? Deeper qualitative follow-up or expanded quantitative tracking could help answer these questions.
8 Appendix: Full Survey Response Table
Code
import pandas as pd# Load datasetdf = pd.read_csv("College Readiness and Educational Experience Survey.csv")# Display the full table exactly as in the CSVdf
Id
Start time
Completion time
Email
Name
Did you attend an IDEA Public School?
If you answered "No", what type of high school did you attend?
What is your current year in college?
On a scale of 1 to 5, how prepared did you feel for college-level coursework when you started?\n(1 means not prepared at all, 5 means extremely well prepared)\n
How would you rate the quality of academic support you received in high school?
...
Do you feel your high school helped you develop the following skills?.Critical thinking skills
Do you feel your high school helped you develop the following skills?.Independent study habits
Do you feel your high school helped you develop the following skills?.Confidence speaking in groups or presentations
Do you feel your high school helped you develop the following skills?.Comfort using digital tools like Excel or Google Sheets
Do you feel your high school helped you develop the following skills?.Ability to find and use data for research decision making
What type of high school data do you think colleges should consider more seriously when evaluating readiness or success?
Did your family feel involved or informed about your academic progress during high school?
How would you describe the quality of teaching you experienced at your high school?
Did you feel your teachers genuinely cared about your success beyond academics?
Optional: Do you feel your high school prepared you for the major or field you are studying in college? Please explain.
0
1
6/3/2025 17:16
6/3/2025 17:19
anonymous
NaN
No
Traditional public high school
Graduate Student
2
Fair
...
Agree
Disagree
Agree
Neutral
Disagree
Standardized test scores (SAT or ACT);GPA and ...
Somewhat involved
Good, teachers generally cared and taught well
Always
NaN
1
2
6/3/2025 17:38
6/3/2025 17:43
anonymous
NaN
No
Traditional public high school
Senior
4
Good
...
Agree
Agree
Strongly Agree
Agree
Agree
GPA and class rank;Standardized test scores (S...
Very involved
Good, teachers generally cared and taught well
Often
NaN
2
3
6/3/2025 18:08
6/3/2025 18:09
anonymous
NaN
No
Traditional public high school
Graduate Student
5
Good
...
Strongly disagree
Strongly disagree
Strongly disagree
Strongly disagree
Strongly disagree
Family background or income;College support se...
Not involved at all
Fair, some teachers were good, others were not
Sometimes
NaN
3
4
6/3/2025 18:11
6/3/2025 18:15
anonymous
NaN
No
Mixed Charter-Public
Senior
5
Excellent
...
Strongly disagree
Strongly disagree
Agree
Agree
Neutral
Participation in extracurricular activities;GP...
Somewhat involved
Excellent, teachers were knowledgeable, suppor...
Always
I was originally in the medical field, BUT too...
4
5
6/3/2025 18:12
6/3/2025 18:18
anonymous
NaN
No
Magnet school - STISD
Freshman
5
Excellent
...
Strongly Agree
Agree
Agree
Strongly Agree
Strongly Agree
Family background or income;Participation in e...
Rarely involved
Excellent, teachers were knowledgeable, suppor...
Always
I decided to go down a different path from my ...
5
6
6/3/2025 18:18
6/3/2025 18:21
anonymous
NaN
No
Traditional public high school
Senior
5
Good
...
Strongly Agree
Strongly Agree
Strongly Agree
Agree
Strongly Agree
GPA and class rank;Standardized test scores (S...
Somewhat involved
Excellent, teachers were knowledgeable, suppor...
Sometimes
No. Just covered the essential gen. ed courses...
6
7
6/3/2025 18:40
6/3/2025 18:42
anonymous
NaN
Yes
NaN
Junior
4
Good
...
Agree
Neutral
Neutral
Neutral
Agree
College support services used;GPA and class rank;
Very involved
Good, teachers generally cared and taught well
Often
Not really, but don't take my word for granted...
7
8
6/3/2025 19:22
6/3/2025 19:23
anonymous
NaN
No
Charter school (non-IDEA)
Sophomore
4
Very poor
...
Strongly Agree
Agree
Agree
Agree
Agree
Participation in extracurricular activities;Ty...
Rarely involved
Excellent, teachers were knowledgeable, suppor...
Always
NaN
8
9
6/3/2025 19:40
6/3/2025 19:44
anonymous
NaN
Yes
NaN
Junior
5
Very poor
...
Strongly Agree
Strongly Agree
Strongly Agree
Strongly Agree
Strongly Agree
Participation in extracurricular activities;GP...
Very involved
Excellent, teachers were knowledgeable, suppor...
Always
Yes, I am majoring in Criminal Justice. As a f...
9
10
6/3/2025 20:24
6/3/2025 20:41
anonymous
NaN
No
Traditional public high school
Junior
1
Poor
...
Disagree
Disagree
Neutral
Neutral
Disagree
GPA and class rank;
Not involved at all
Fair, some teachers were good, others were not
Sometimes
Not at all,they only offered help for mechanic...
10
11
6/3/2025 22:01
6/3/2025 22:22
anonymous
NaN
No
Traditional public high school
Senior
5
Fair
...
Disagree
Agree
Disagree
Neutral
Disagree
None of these or not sure;
Very involved
Fair, some teachers were good, others were not
Sometimes
Nope. I had no idea what I actually wanted to ...
11
12
6/3/2025 23:07
6/3/2025 23:10
anonymous
NaN
No
Charter school (non-IDEA)
Graduate Student
1
Poor
...
Neutral
Neutral
Neutral
Neutral
Strongly disagree
None of these or not sure;
Rarely involved
Fair, some teachers were good, others were not
Rarely
Nope not at all. I wish I had never gotten cre...
12
13
6/3/2025 23:12
6/3/2025 23:15
anonymous
NaN
No
Traditional public high school
Junior
4
Poor
...
Strongly disagree
Strongly disagree
Strongly disagree
Strongly disagree
Strongly disagree
Family background or income;
Not involved at all
Fair, some teachers were good, others were not
Sometimes
NaN
13
14
6/4/2025 0:24
6/4/2025 0:32
anonymous
NaN
Yes
NaN
Sophomore
5
Poor
...
Disagree
Strongly disagree
Strongly disagree
Strongly disagree
Strongly disagree
Participation in extracurricular activities;GP...
Rarely involved
Fair, some teachers were good, others were not
Often
No because my school offered AP courses that d...
14
15
6/4/2025 10:42
6/4/2025 10:44
anonymous
NaN
No
Traditional public high school
Graduate Student
5
Good
...
Neutral
Neutral
Neutral
Neutral
Neutral
College support services used;Type of school a...
Somewhat involved
Good, teachers generally cared and taught well
Sometimes
NaN
15
16
6/4/2025 14:09
6/4/2025 14:12
anonymous
NaN
No
Charter school (non-IDEA)
Graduated already
5
Excellent
...
Strongly Agree
Strongly Agree
Strongly Agree
Agree
Strongly Agree
GPA and class rank;College support services used;
Very involved
Excellent, teachers were knowledgeable, suppor...
Always
NaN
16
17
6/5/2025 18:58
6/5/2025 19:02
anonymous
NaN
Yes
NaN
Graduate Student
4
Good
...
Strongly Agree
Agree
Disagree
Agree
Agree
GPA and class rank;Participation in extracurri...
Somewhat involved
Good, teachers generally cared and taught well
Often
No. I am a computer science major and my Highs...
17 rows × 24 columns
Source Code
---title: "College Readiness Survey and Data Analysis"author: "Vicente Ruiz"date: "2025-06-03"format: html: toc: true toc-title: "Table of Contents" toc-location: left number-sections: true code-fold: true code-tools: true smooth-scroll: true theme: cosmoeditor: visual---# Project OverviewAs part of my application for a Data Analyst role at IDEA Public Schools, I designed and conducted an original survey to explore how different high school experiences impact college readiness and student success. The project compares students from IDEA Public Schools to those from traditional public schools and other educational backgrounds. The analysis focuses on key factors such as dual enrollment, extracurricular involvement, skill development, family engagement, and alignment between high school preparation and college major.# Analysis ApproachThe analysis focuses on identifying patterns and relationships between key aspects of students' high school experiences and their outcomes in college. For each comparison, results are presented separately for IDEA and non-IDEA students. The methods and visualizations for each analysis are specified below.- **Dual enrollment participation (Q7):** - Compared with: - Q4: College preparedness - Q9: Time management confidence during first semester of college - **Purpose:** Does taking college-level courses in high school improve college readiness or confidence in managing responsibilities? - *Methods:* Group comparisons (means) - *Visualization:* Bar charts- **Extracurricular involvement (Q8):** - Compared with: - Q4: College preparedness - Q9: Time management confidence during first semester of college - **Purpose:** Is there a relationship between extracurricular involvement in high school and students’ college readiness or time management skills in college? - *Methods:* Group comparisons (means) - *Visualization:* Bar charts- **Family engagement (Q12):** - Compared with: - Q4: College preparedness - **Purpose:** How does family involvement during high school relate to students’ sense of college readiness? - *Methods:* Group comparisons (means) - *Visualization:* Bar charts- **Skills development (Q10):** - Compared with: - Q4: College preparedness - **Purpose:** Which high school experiences are most strongly associated with feeling ready for college? - *Methods:* Group comparisons (means) - *Visualization:* Bar charts- **Academic support received (Q5):** - Compared with: - Q4: College preparedness - **Purpose:** Does the quality of academic support in high school relate to higher college preparedness? - *Methods:* Group comparisons (means) - *Visualization:* Bar charts- **Quality of teaching and teacher care (Q13 & Q14):** - Compared with: - Q4: College preparedness - **Purpose:** Are students' perceptions of teaching quality and teacher support associated with greater college readiness? - *Methods:* Group comparisons (means) - *Visualization:* Bar charts- **Breadth of support services (Q6):** - Compared with: - Q4: College preparedness - Q9: Time management confidence - **Purpose:** Does having access to a wider range of support services in high school relate to higher preparedness and better time management skills? Which individual supports are most strongly associated with higher scores? - *Methods:* Group comparisons (means); count of support services - *Visualization:* Bar charts, Line chartsDue to the small number of survey responses, the analysis focuses on group comparisons using averages (means) to highlight trends and differences across groups. More advanced statistical methods were not applied, as they would not yield reliable results with this sample size. All visualizations are created in Quarto to present findings clearly for educational leaders.**Note:** In all visualizations, results are shown separately for IDEA and non-IDEA students, and categories with no responses are omitted for clarity. The full list of survey response options is included in the appendix.# Likert Scale MappingSeveral survey questions used Likert-style or ordinal response formats (for example, "Very confident" to "Not at all confident", "Excellent" to "Very poor", or "Strongly agree" to "Strongly disagree"). To enable statistical analysis, these responses were mapped to corresponding numeric values on a 1 to 5 scale, with higher values representing more positive outcomes or stronger agreement. This allowed for the calculation of means, correlations, and regression models while preserving the ordinal nature of the data.# Key InsightsThis section summarizes the most important findings from the survey analysis. The goal is to highlight actionable insights that could inform decisions around school practices, program investments, and student support strategies. The following key patterns emerged from the data:- **Impact of Dual Enrollment:** Students who participated in dual enrollment or AP courses reported higher levels of college preparedness and stronger time management confidence compared to those who did not take advanced courses. Among IDEA students, every respondent participated in some form of advanced coursework and reported high preparedness. In the non-IDEA group, the highest scores were also associated with dual enrollment or AP participation, while the only students who felt completely unprepared had not taken any advanced courses or expressed regret about their dual enrollment experience.- **Extracurricular Involvement:** Students who reported greater involvement in extracurriculars generally felt more prepared for college and more confident managing their time. This pattern held for both IDEA and non-IDEA students, though a few non-IDEA students who reported no extracurricular involvement still felt highly prepared. Outliers suggest that lack of alignment between school supports and students’ career interests can undermine preparedness even among highly involved students.- **Family Engagement:** Among non-IDEA students, greater family involvement was associated with higher college preparedness. Among IDEA students, results were more mixed, likely due to small sample size. Some students with highly involved families still reported low preparedness, suggesting that family support alone may not compensate for gaps in school support or guidance.- **Skills Development:** Students who strongly agreed that their high school helped them develop key academic skills generally reported higher college preparedness. IDEA students who selected “Strongly agree” for each skill consistently reported the highest preparedness ratings. However, several students across both groups felt well prepared for college even when reporting weak skill development, reflecting how individual pathways and experiences can shape perceptions of readiness.- **Academic Support:** Among non-IDEA students, stronger academic support was clearly linked to higher preparedness. Among IDEA students, results were more varied, with some students rating their support as “Poor” or “Very poor” yet still reporting high preparedness. This may reflect differences in the quality of supports across campuses or differences in how students interpret academic support.- **Quality of teaching and teaching care:** Higher perceived teaching quality and stronger teacher care were generally associated with greater college preparedness, particularly among non-IDEA students. Among IDEA students, small sample sizes produced some inconsistent patterns. The overall trend suggests that positive teaching experiences and strong teacher relationships can contribute to student readiness for college.- **Breadth of support services:** Students who reported access to a broader range of support services generally reported higher preparedness and stronger time management confidence. This pattern was especially clear among non-IDEA students. Notably, some non-IDEA students reported no services at all, which may reflect either a true lack of services or a lack of student awareness. While IDEA students generally reported strong access to services, one student’s open-ended response suggested that the quality and depth of those services may vary across campuses.These findings can help inform future improvements in curriculum design, extracurricular offerings, family engagement strategies, and support for advanced coursework.# Detailed Results## Dual Enrollment participationWe examined whether participating in dual enrollment or AP courses in high school was associated with two outcomes: students’ college preparedness and their confidence in managing time and responsibilities during their first semester of college. Among IDEA students, those who participated in dual enrollment reported the highest possible scores for both preparedness and time management, while those who took only AP courses reported high preparedness but average confidence in time management. No IDEA students reported not participating in any advanced courses, so this group could not be analyzed. For non-IDEA students, those who took dual enrollment or AP courses had higher average preparedness and time management scores than those who took no advanced courses. These results suggest that dual enrollment and AP participation are linked with feeling more prepared for college and better equipped to manage time.Notably, only two students in the entire sample rated themselves as “not at all” prepared or confident in managing time, and both were non-IDEA students. The student who did not take any advanced courses wrote, “Not at all, they only offered help for mechanical engineering majors.” The other, who took dual enrollment, stated, “Nope not at all. I wish I had never gotten credits from high school.” These outlier responses highlight that individual experiences, such as limited course offerings or a mismatch between high school courses and a student’s intended college major, can strongly influence perceptions of readiness regardless of participation in advanced coursework.```{python}import pandas as pdimport numpy as npimport matplotlib.pyplot as plt# Load your data (adjust path if needed)df = pd.read_csv("College Readiness and Educational Experience Survey.csv")# Prep columns and mappingsde_col ="Did you take any college level courses during high school?"q4 ="On a scale of 1 to 5, how prepared did you feel for college-level coursework when you started?\n(1 means not prepared at all, 5 means extremely well prepared)\n "idea_col ="Did you attend an IDEA Public School?"q9 = [c for c in df.columns if"How confident were you in managing your own time"in c][0]df["IDEA"] = df[idea_col].map({"Yes": "IDEA", "No": "Non-IDEA"})tm_map = {"Very confident": 5,"Somewhat confident": 4,"Neutral": 3,"Not very confident": 2,"Not at all confident": 1}df["TimeManagement"] = df[q9].map(tm_map)df["Preparedness"] = pd.to_numeric(df[q4], errors="coerce")# Dual enrollment groupsdef group_de(row): r =str(row).lower()if"dual enrollment"in r or"early college"in r:return"Dual Enrollment"elif"ap"in r:return"AP Only"elif"no"in r:return"None"else:returnNonedf["DE_Group"] = df[de_col].apply(group_de)de_labels = ["AP Only", "Dual Enrollment", "None"]# Helper for group means by DE statusdef de_stats(df, group): subset = df[(df["IDEA"] == group) & df["DE_Group"].notna() & df["Preparedness"].notna() & df["TimeManagement"].notna()] means_p = subset.groupby("DE_Group")["Preparedness"].mean().reindex(de_labels) means_tm = subset.groupby("DE_Group")["TimeManagement"].mean().reindex(de_labels)return means_p, means_tmmeans_idea, means_idea_tm = de_stats(df, "IDEA")means_nonidea, means_nonidea_tm = de_stats(df, "Non-IDEA")def bar_data(m1, m2): mask = m1.notna() | m2.notna()return m1[mask], m2[mask], [l for l, k inzip(de_labels, mask) if k]prep_idea, tm_idea, labels_idea = bar_data(means_idea, means_idea_tm)prep_nonidea, tm_nonidea, labels_nonidea = bar_data(means_nonidea, means_nonidea_tm)width =0.35fig, axes = plt.subplots(1, 2, figsize=(13,5), sharey=True)# IDEA chartx_idea = np.arange(len(labels_idea))axes[0].bar(x_idea - width/2, prep_idea, width, label='Preparedness', color='#4C72B0')axes[0].bar(x_idea + width/2, tm_idea, width, label='Time Management', color='#55A868')axes[0].set_xticks(x_idea)axes[0].set_xticklabels(labels_idea)axes[0].set_ylim(0, 5)axes[0].set_ylabel("Average Score (1-5)")axes[0].set_title("IDEA Students Only")axes[0].legend(loc='upper center', bbox_to_anchor=(0.5, -0.18), ncol=2, frameon=False)# Non-IDEA chartx_nonidea = np.arange(len(labels_nonidea))axes[1].bar(x_nonidea - width/2, prep_nonidea, width, label='Preparedness', color='#4C72B0')axes[1].bar(x_nonidea + width/2, tm_nonidea, width, label='Time Management', color='#55A868')axes[1].set_xticks(x_nonidea)axes[1].set_xticklabels(labels_nonidea)axes[1].set_ylim(0, 5)axes[1].set_title("Non-IDEA Students Only")axes[1].legend(loc='upper center', bbox_to_anchor=(0.5, -0.18), ncol=2, frameon=False)plt.suptitle("Dual Enrollment Participation vs. Preparedness and Time Management")plt.tight_layout(rect=[0, 0, 1, 0.95])plt.show()# Outlier detection for Dual Enrollment Impacts (Q4 and Q9)q15_col = [c for c in df.columns if"Do you feel your high school prepared you for the major"in c][0]outliers = df[ ( (df["Preparedness"] ==1) | (df["TimeManagement"] ==1) ) & df["DE_Group"].notna()]outliers_summary = outliers[["IDEA", "DE_Group", "Preparedness", "TimeManagement", q15_col]]```## Extracurricular involvementWe examined whether students’ involvement in extracurricular activities during high school was associated with their self-reported college preparedness and time management confidence. Among IDEA students, those who reported being very involved in extracurriculars felt the most prepared for college, with an average preparedness score of 5.0 and a time management score of 3.5. IDEA students who were not very involved still reported a high average preparedness of 4.0 and time management of 4.0. For non-IDEA students, those who were very involved in extracurriculars had an average preparedness score of 3.86 and a time management score of 3.57, while those who were somewhat involved had similar averages (3.8 for preparedness and 4.0 for time management). Interestingly, the few non-IDEA students who were not involved at all reported the highest possible scores (5.0) for both preparedness and time management, though this result is based on a very small number of responses.Notably, two outliers were observed among non-IDEA students. One student who was very involved in extracurriculars reported feeling not at all prepared for college and not at all confident in managing time, writing, “Not at all, they only offered help for mechanical engineering majors.” Another student who was somewhat involved in extracurriculars gave the lowest possible preparedness rating but reported high time management confidence, commenting, “Nope not at all. I wish I had never gotten credits from high school.” These outlier responses suggest that, despite overall trends, individual perceptions of readiness can be shaped by factors such as limited high school support for certain career paths or dissatisfaction with advanced course credits.```{python}import pandas as pdimport numpy as npimport matplotlib.pyplot as plt# Load data (adjust path if needed)df = pd.read_csv("College Readiness and Educational Experience Survey.csv")# Prepare columns and mappingsq4 ="On a scale of 1 to 5, how prepared did you feel for college-level coursework when you started?\n(1 means not prepared at all, 5 means extremely well prepared)\n "q8 ="Were you involved in extracurricular activities during high school?"q9 = [c for c in df.columns if"How confident were you in managing your own time"in c][0]idea_col ="Did you attend an IDEA Public School?"df["IDEA"] = df[idea_col].map({"Yes": "IDEA", "No": "Non-IDEA"})tm_map = {"Very confident": 5,"Somewhat confident": 4,"Neutral": 3,"Not very confident": 2,"Not at all confident": 1}df["TimeManagement"] = df[q9].map(tm_map)df["Preparedness"] = pd.to_numeric(df[q4], errors="coerce")xtra_labels = ["Yes, I was very involved","Yes, I was somewhat involved","I was not very involved","I was not involved at all"]# Function to prep group stats for each subgroupdef extra_stats(df, group): subset = df[(df["IDEA"] == group) & df["Preparedness"].notna() & df["TimeManagement"].notna() & df[q8].notna()] means_p = subset.groupby(q8)["Preparedness"].mean().reindex(xtra_labels) means_tm = subset.groupby(q8)["TimeManagement"].mean().reindex(xtra_labels)return means_p, means_tmmeans_p_idea, means_tm_idea = extra_stats(df, "IDEA")means_p_nonidea, means_tm_nonidea = extra_stats(df, "Non-IDEA")# Prepare chart data (drop NaNs)def bar_data(m1, m2): mask = m1.notna() | m2.notna()return m1[mask], m2[mask], [l for l, k inzip(xtra_labels, mask) if k]prep_idea, tm_idea, labels_idea = bar_data(means_p_idea, means_tm_idea)prep_nonidea, tm_nonidea, labels_nonidea = bar_data(means_p_nonidea, means_tm_nonidea)width =0.35fig, axes = plt.subplots(1, 2, figsize=(13,5), sharey=True)# IDEA Studentsx_idea = np.arange(len(labels_idea))axes[0].bar(x_idea - width/2, prep_idea, width, label='Preparedness', color='#4C72B0')axes[0].bar(x_idea + width/2, tm_idea, width, label='Time Management', color='#55A868')axes[0].set_xticks(x_idea)axes[0].set_xticklabels(labels_idea, rotation=15)axes[0].set_ylim(0, 5)axes[0].set_ylabel("Average Score (1-5)")axes[0].set_title("IDEA Students Only")axes[0].legend(loc='upper center', bbox_to_anchor=(0.5, -0.28), ncol=2, frameon=False)# Non-IDEA Studentsx_nonidea = np.arange(len(labels_nonidea))axes[1].bar(x_nonidea - width/2, prep_nonidea, width, label='Preparedness', color='#4C72B0')axes[1].bar(x_nonidea + width/2, tm_nonidea, width, label='Time Management', color='#55A868')axes[1].set_xticks(x_nonidea)axes[1].set_xticklabels(labels_nonidea, rotation=15)axes[1].set_ylim(0, 5)axes[1].set_title("Non-IDEA Students Only")axes[1].legend(loc='upper center', bbox_to_anchor=(0.5, -0.28), ncol=2, frameon=False)plt.suptitle("Extracurricular Involvement vs. Preparedness and Time Management")plt.tight_layout(rect=[0, 0, 1, 0.95])plt.show()# Outlier detection for Extracurricular Impacts (Q4 and Q9)q15_col = [c for c in df.columns if"Do you feel your high school prepared you for the major"in c][0]outliers = df[ ( (df["Preparedness"] ==1) | (df["TimeManagement"] ==1) ) & df[q8].notna()]outliers_summary = outliers[["IDEA", q8, "Preparedness", "TimeManagement", q15_col]]```## Family engagementWe examined whether students who felt their families were more involved in their academic progress during high school reported higher levels of college preparedness. Among IDEA students, the small number of responses meant that not all categories were represented. Of the available responses, those who described their families as “rarely involved” reported a higher average preparedness score than those who described their families as “very involved.” For non-IDEA students, the more typical pattern emerged: students who reported “very involved” or “somewhat involved” families tended to feel more prepared for college compared to those who reported their families were “rarely involved” or “not involved at all.”Reviewing for outliers, one non-IDEA student with a preparedness score of 1 indicated that their family was “very involved.” In their open-ended response, they wrote, “Not at all, they only offered help for mechanical engineering majors.” Another non-IDEA outlier who rated their family as “rarely involved” also gave a preparedness score of 1, writing, “Nope not at all. I wish I had never gotten credits from high school.” These responses suggest that, even with strong or weak family involvement, students may feel unprepared if school support or guidance does not align with their intended field or interests.```{python}import pandas as pdimport numpy as npimport matplotlib.pyplot as plt# Load your data (adjust path if needed)df = pd.read_csv("College Readiness and Educational Experience Survey.csv")# Prep columnsq4 ="On a scale of 1 to 5, how prepared did you feel for college-level coursework when you started?\n(1 means not prepared at all, 5 means extremely well prepared)\n "q12 ="Did your family feel involved or informed about your academic progress during high school?"idea_col ="Did you attend an IDEA Public School?"df["IDEA"] = df[idea_col].map({"Yes": "IDEA", "No": "Non-IDEA"})df["Preparedness"] = pd.to_numeric(df[q4], errors="coerce")family_labels = ["Very involved","Somewhat involved","Rarely involved","Not involved at all","Not sure"]def fam_stats(df, group): subset = df[(df["IDEA"] == group) & df["Preparedness"].notna() & df[q12].notna()] means_p = subset.groupby(q12)["Preparedness"].mean().reindex(family_labels)return means_pmeans_idea = fam_stats(df, "IDEA")means_nonidea = fam_stats(df, "Non-IDEA")def bar_data(m): mask = m.notna()return m[mask], [l for l, k inzip(family_labels, mask) if k]prep_idea, labels_idea = bar_data(means_idea)prep_nonidea, labels_nonidea = bar_data(means_nonidea)width =0.5fig, axes = plt.subplots(1, 2, figsize=(13,5), sharey=True)# IDEA chartx_idea = np.arange(len(labels_idea))axes[0].bar(x_idea, prep_idea, width, color='#4C72B0')axes[0].set_xticks(x_idea)axes[0].set_xticklabels(labels_idea, rotation=15)axes[0].set_ylim(0, 5)axes[0].set_ylabel("Average Preparedness (1-5)")axes[0].set_title("IDEA Students Only")# Non-IDEA chartx_nonidea = np.arange(len(labels_nonidea))axes[1].bar(x_nonidea, prep_nonidea, width, color='#4C72B0')axes[1].set_xticks(x_nonidea)axes[1].set_xticklabels(labels_nonidea, rotation=15)axes[1].set_ylim(0, 5)axes[1].set_title("Non-IDEA Students Only")plt.suptitle("Family Engagement vs. College Preparedness")plt.tight_layout(rect=[0, 0, 1, 0.95])plt.show()# Outlier detection: preparedness = 1outliers = df[(df["Preparedness"] ==1) & df[q12].notna()]q15_col = [c for c in df.columns if"Do you feel your high school prepared you for the major"in c][0]outliers_summary = outliers[["IDEA", q12, "Preparedness", q15_col]]```## Skills developmentWe examined whether students who felt their high school helped them develop specific academic skills reported higher levels of college preparedness. Among IDEA students, all of those who selected “Strongly agree” for the available skills also reported the highest possible preparedness rating of 5. This resulted in average preparedness scores of 5 across all skills for IDEA students in the chart. For non-IDEA students, the pattern was similar: students who selected “Strongly agree” generally reported high levels of preparedness, though with more variation across skills.Reviewing for outliers, one IDEA student with a preparedness score of 5 selected “Strongly disagree” for multiple skills, including “Independent study habits,” “Confidence speaking in groups or presentations,” “Comfort using digital tools like Excel or Google Sheets,” and “Ability to find and use data for research decision making.” In their open-ended response, they wrote, “No because my school offered AP courses that did not transfer into my degree. So I took those classes for nothing and it was very upsetting. I was in the top 10% of my class, yet earned little to no college credit. My school only encouraged us to apply to college outside of TX rather than an affordable option like UTRGV.”Another Non-IDEA student with a preparedness score of 5 selected “Strongly disagree” for “Critical thinking skills” and “Independent study habits.” In their open-ended response, they wrote, “I was originally in the medical field, BUT too many math classes were required for my program. I had to switch to education because I had taken so many education classes for my AP certification.” These responses suggest that, even when students feel that specific academic skills were not strongly developed in high school, they may still perceive themselves as well prepared for college, depending on their individual pathways and experiences.```{python}import pandas as pdimport numpy as npimport matplotlib.pyplot as plt# Load datasetdf = pd.read_csv("College Readiness and Educational Experience Survey.csv")# Identify relevant columnsq4 ="On a scale of 1 to 5, how prepared did you feel for college-level coursework when you started?\n(1 means not prepared at all, 5 means extremely well prepared)\n "idea_col ="Did you attend an IDEA Public School?"# Find Q10 skill columnsq10_cols = [col for col in df.columns if"Do you feel your high school helped you develop"in col]# Prep IDEA and Preparedness columnsdf["IDEA"] = df[idea_col].map({"Yes": "IDEA", "No": "Non-IDEA"})df["Preparedness"] = pd.to_numeric(df[q4], errors="coerce")# Function to compute mean preparedness for Strongly agree responses (with text cleanup)def compute_strongly_agree_means(df, group): means = []for skill_col in q10_cols: subset = df[ (df["IDEA"] == group) & (df["Preparedness"].notna()) & (df[skill_col].str.strip().str.lower() =="strongly agree") ] mean_prep = subset["Preparedness"].mean() means.append(mean_prep)return means# Compute meansmeans_idea = compute_strongly_agree_means(df, "IDEA")means_nonidea = compute_strongly_agree_means(df, "Non-IDEA")# Plot clean horizontal bar chartsfig, axes = plt.subplots(1, 2, figsize=(14, 6), sharey=True)# Assign colors to skillscolors = plt.cm.tab20.colors[:len(q10_cols)]# IDEA plotx_pos = np.arange(len(q10_cols))axes[0].bar(x_pos, means_idea, color=colors)axes[0].set_xticks([])axes[0].set_ylim(0, 5)axes[0].set_ylabel("Average Preparedness (1-5)")axes[0].set_title("IDEA Students")# Non-IDEA plotaxes[1].bar(x_pos, means_nonidea, color=colors)axes[1].set_xticks([])axes[1].set_ylim(0, 5)axes[1].set_title("Non-IDEA Students")# Add legendhandles = [plt.Rectangle((0,0),1,1, color=colors[i]) for i inrange(len(q10_cols))]fig.legend(handles, q10_cols, loc='lower center', bbox_to_anchor=(0.5, -0.02), ncol=2, fontsize='small')plt.tight_layout(rect=[0, 0.07, 1, 1])plt.show()# Outlier detection: Strongly agree + Prep=1 OR Strongly disagree + Prep=5q15_col = [c for c in df.columns if"Do you feel your high school prepared you for the major"in c][0]outlier_rows = []for skill_col in q10_cols: outliers = df[ ((df[skill_col].str.strip().str.lower() =="strongly agree") & (df["Preparedness"] ==1)) | ((df[skill_col].str.strip().str.lower() =="strongly disagree") & (df["Preparedness"] ==5)) ]ifnot outliers.empty: temp = outliers[["IDEA", skill_col, "Preparedness", q15_col]].copy() outlier_rows.append(temp)# Combine all outliers into one dataframeif outlier_rows: outliers_summary = pd.concat(outlier_rows, ignore_index=True)else: outliers_summary = pd.DataFrame(columns=["IDEA", skill_col, "Preparedness", q15_col])```## Academic SupportWe examined whether students who felt they received stronger academic support in high school reported higher levels of college preparedness. Among IDEA students, the small number of responses meant that not all categories were represented. Of the available responses, those who rated their academic support as “Poor” or “Very poor” reported higher average preparedness scores than those who rated their support as “Good.” This unexpected pattern is likely due to the small sample size of IDEA students in this category. For non-IDEA students, the more typical pattern was observed: students who rated their academic support more positively tended to report higher levels of preparedness.Reviewing for outliers, one IDEA student with a preparedness score of 5 rated their academic support as “Very poor.” In their open-ended response, they wrote, “Yes, I am majoring in Criminal Justice. As a first-generation college student, I have struggled finding scholarships, guidance, and financial advice from my high school. I have had to learn everything on my own.” This suggests that, in some cases, students may feel academically prepared for college despite perceiving major gaps in the academic support they received during high school.```{python}import pandas as pdimport numpy as npimport matplotlib.pyplot as plt# Load datasetdf = pd.read_csv("College Readiness and Educational Experience Survey.csv")# Identify relevant columnsq4 ="On a scale of 1 to 5, how prepared did you feel for college-level coursework when you started?\n(1 means not prepared at all, 5 means extremely well prepared)\n "q5 ="How would you rate the quality of academic support you received in high school?"idea_col ="Did you attend an IDEA Public School?"# Prep IDEA and Preparedness columnsdf["IDEA"] = df[idea_col].map({"Yes": "IDEA", "No": "Non-IDEA"})df["Preparedness"] = pd.to_numeric(df[q4], errors="coerce")# Define the correct order of responsessupport_labels = ["Excellent","Good","Fair","Poor","Very poor"]# Function to compute mean preparedness by academic support leveldef support_stats(df, group): subset = df[(df["IDEA"] == group) & df["Preparedness"].notna() & df[q5].notna()] means_p = subset.groupby(q5)["Preparedness"].mean().reindex(support_labels)return means_p# Compute means for IDEA and Non-IDEAmeans_idea = support_stats(df, "IDEA")means_nonidea = support_stats(df, "Non-IDEA")# Prepare bar datadef bar_data(m): mask = m.notna()return m[mask], [l for l, k inzip(support_labels, mask) if k]prep_idea, labels_idea = bar_data(means_idea)prep_nonidea, labels_nonidea = bar_data(means_nonidea)# Plot side-by-side bar chartswidth =0.5fig, axes = plt.subplots(1, 2, figsize=(13, 5), sharey=True)# IDEA chartx_idea = np.arange(len(labels_idea))axes[0].bar(x_idea, prep_idea, width, color='#4C72B0')axes[0].set_xticks(x_idea)axes[0].set_xticklabels(labels_idea, rotation=15)axes[0].set_ylim(0, 5)axes[0].set_ylabel("Average Preparedness (1-5)")axes[0].set_title("IDEA Students Only")# Non-IDEA chartx_nonidea = np.arange(len(labels_nonidea))axes[1].bar(x_nonidea, prep_nonidea, width, color='#4C72B0')axes[1].set_xticks(x_nonidea)axes[1].set_xticklabels(labels_nonidea, rotation=15)axes[1].set_ylim(0, 5)axes[1].set_title("Non-IDEA Students Only")plt.suptitle("Academic Support vs. College Preparedness")plt.tight_layout(rect=[0, 0, 1, 0.95])plt.show()# Outlier detection: "Excellent" + Prep=1 and "Poor" + Prep=5q15_col = [c for c in df.columns if"Do you feel your high school prepared you for the major"in c][0]outliers = df[ ((df[q5].str.strip().str.lower() =="excellent") & (df["Preparedness"] ==1)) | ((df[q5].str.strip().str.lower() =="very poor") & (df["Preparedness"] ==5))]ifnot outliers.empty: outliers_summary = outliers[["IDEA", q5, "Preparedness", q15_col]]else: outliers_summary = pd.DataFrame(columns=["IDEA", q5, "Preparedness", q15_col])```## Quality of teaching and teaching careWe examined whether students who felt they experienced higher quality teaching or stronger teacher support in high school reported higher levels of college preparedness. Among IDEA students, responses for teaching quality were limited, and not all categories were represented. Of the available responses, students who rated teaching quality as “Fair” reported higher average preparedness scores than those who rated it as “Good,” a pattern likely influenced by the small number of responses in each category. Among non-IDEA students, a more typical pattern was observed: students who rated teaching quality more positively tended to report higher preparedness.For teacher care, IDEA students again provided a limited range of responses, with most selecting either “Always” or “Often.” Those who selected “Always” reported higher average preparedness than those who selected “Often.” Among non-IDEA students, responses spanned a wider range. While preparedness generally aligned with reported levels of teacher care, there were some inconsistencies across the mid-range categories, which may reflect variation in student experiences or small sample sizes.No outliers were detected for either measure in this analysis.```{python}import pandas as pdimport numpy as npimport matplotlib.pyplot as plt# Load datasetdf = pd.read_csv("College Readiness and Educational Experience Survey.csv")# Identify relevant columnsq4 ="On a scale of 1 to 5, how prepared did you feel for college-level coursework when you started?\n(1 means not prepared at all, 5 means extremely well prepared)\n "q13 ="How would you describe the quality of teaching you experienced at your high school?"q14 ="Did you feel your teachers genuinely cared about your success beyond academics?"idea_col ="Did you attend an IDEA Public School?"# Prep IDEA and Preparedness columnsdf["IDEA"] = df[idea_col].map({"Yes": "IDEA", "No": "Non-IDEA"})df["Preparedness"] = pd.to_numeric(df[q4], errors="coerce")# Define correct order of responses for Q13q13_labels = ["Excellent, teachers were knowledgeable, supportive, and engaging","Good, teachers generally cared and taught well","Fair, some teachers were good, others were not","Poor, teaching was inconsistent or unengaging","Very poor, teachers seemed unmotivated or ineffective"]# Define correct order of responses for Q14q14_labels = ["Always","Often","Sometimes","Rarely","Never"]# Function to compute mean preparedness for any questiondef compute_means(df, group, question_col, labels): subset = df[(df["IDEA"] == group) & df["Preparedness"].notna() & df[question_col].notna()] means_p = subset.groupby(question_col)["Preparedness"].mean().reindex(labels)return means_p# Function to prepare bar datadef bar_data(m, labels): mask = m.notna()return m[mask], [l for l, k inzip(labels, mask) if k]# Plot function for Q13 (with LEGEND instead of long labels)def plot_q13_with_legend(question_col, labels, title_suffix): means_idea = compute_means(df, "IDEA", question_col, labels) means_nonidea = compute_means(df, "Non-IDEA", question_col, labels) prep_idea, labels_idea = bar_data(means_idea, labels) prep_nonidea, labels_nonidea = bar_data(means_nonidea, labels)# Plot width =0.5 fig, axes = plt.subplots(1, 2, figsize=(13, 6), sharey=True)# IDEA chart x_idea = np.arange(len(labels_idea)) axes[0].bar(x_idea, prep_idea, width, color='#4C72B0') axes[0].set_xticks(x_idea) axes[0].set_xticklabels([str(i+1) for i inrange(len(labels_idea))]) axes[0].set_ylim(0, 5) axes[0].set_ylabel("Average Preparedness (1-5)") axes[0].set_title("IDEA Students Only")# Non-IDEA chart x_nonidea = np.arange(len(labels_nonidea)) axes[1].bar(x_nonidea, prep_nonidea, width, color='#4C72B0') axes[1].set_xticks(x_nonidea) axes[1].set_xticklabels([str(i+1) for i inrange(len(labels_nonidea))]) axes[1].set_ylim(0, 5) axes[1].set_title("Non-IDEA Students Only") plt.suptitle(f"{title_suffix} vs. College Preparedness") plt.tight_layout(rect=[0, 0.08, 1, 0.95])# Add LEGEND below handles = [plt.Rectangle((0,0),1,1, color='#4C72B0')] *len(labels) fig.legend(handles, [f"{i+1}: {label}"for i, label inenumerate(labels)], loc='lower center', bbox_to_anchor=(0.5, -0.07), ncol=1, fontsize='small') plt.show()# Plot function for Q14 (standard labels)def plot_q14_standard(question_col, labels, title_suffix): means_idea = compute_means(df, "IDEA", question_col, labels) means_nonidea = compute_means(df, "Non-IDEA", question_col, labels) prep_idea, labels_idea = bar_data(means_idea, labels) prep_nonidea, labels_nonidea = bar_data(means_nonidea, labels)# Plot width =0.5 fig, axes = plt.subplots(1, 2, figsize=(13, 5), sharey=True)# IDEA chart x_idea = np.arange(len(labels_idea)) axes[0].bar(x_idea, prep_idea, width, color='#4C72B0') axes[0].set_xticks(x_idea) axes[0].set_xticklabels(labels_idea, rotation=15) axes[0].set_ylim(0, 5) axes[0].set_ylabel("Average Preparedness (1-5)") axes[0].set_title("IDEA Students Only")# Non-IDEA chart x_nonidea = np.arange(len(labels_nonidea)) axes[1].bar(x_nonidea, prep_nonidea, width, color='#4C72B0') axes[1].set_xticks(x_nonidea) axes[1].set_xticklabels(labels_nonidea, rotation=15) axes[1].set_ylim(0, 5) axes[1].set_title("Non-IDEA Students Only") plt.suptitle(f"{title_suffix} vs. College Preparedness") plt.tight_layout(rect=[0, 0, 1, 0.95]) plt.show()# ---- Plot Q13 with LEGEND ----plot_q13_with_legend(q13, q13_labels, "Quality of Teaching")# ---- Plot Q14 standard ----plot_q14_standard(q14, q14_labels, "Teacher Care and Support")# ---- Outlier detection for Q13 ----q15_col = [c for c in df.columns if"Do you feel your high school prepared you for the major"in c][0]outliers_q13 = df[ ((df[q13].str.strip().str.lower() =="excellent, teachers were knowledgeable, supportive, and engaging") & (df["Preparedness"] ==1)) | ((df[q13].str.strip().str.lower() =="very poor, teachers seemed unmotivated or ineffective") & (df["Preparedness"] ==5))]ifnot outliers_q13.empty: outliers_summary_q13 = outliers_q13[["IDEA", q13, "Preparedness", q15_col]]else: outliers_summary_q13 = pd.DataFrame(columns=["IDEA", q13, "Preparedness", q15_col])# ---- Outlier detection for Q14 ----outliers_q14 = df[ ((df[q14].str.strip().str.lower() =="always") & (df["Preparedness"] ==1)) | ((df[q14].str.strip().str.lower() =="never") & (df["Preparedness"] ==5))]ifnot outliers_q14.empty: outliers_summary_q14 = outliers_q14[["IDEA", q14, "Preparedness", q15_col]]else: outliers_summary_q14 = pd.DataFrame(columns=["IDEA", q14, "Preparedness", q15_col])```## Breadth of support servicesWe examined whether access to a broader range of support services in high school was associated with higher levels of college preparedness and greater confidence in time management. Among IDEA students, those who reported access to more services tended to report higher preparedness and time management confidence. However, the relatively small number of responses at some levels of service breadth may contribute to variation in these results. For non-IDEA students, a clearer trend emerged: students with access to more services reported progressively higher preparedness and time management confidence.Interestingly, non-IDEA students were the only group in which some students reported that their school offered no services at all. This may reflect either an actual lack of services, or a lack of student awareness about services offered. As one non-IDEA student noted, it is not uncommon for students to be unaware of available resources at their school. However, IDEA students are not immune to this dynamic. One IDEA student selected all services when asked, but also wrote in their open-ended response: “Yes, I am majoring in Criminal Justice. As a freshman, students are required to take a business class. As a sophomore, students are required to take a computer science class. As a junior, students are required to take a nursing class. As a senior, we were required to take a principles of law class. We were able to deeply explore various fields of education and work.” This suggests that while many IDEA schools offer a wide range of supports, the depth and quality of those supports may vary across campuses.When examining individual services, the overall trends for IDEA and non-IDEA students were relatively similar. In both groups, certain services such as Time management skills and Career or major exploration were associated with somewhat higher average preparedness and time management confidence. No outliers were detected in this analysis.```{python}import pandas as pdimport numpy as npimport matplotlib as mplimport matplotlib.pyplot as plt# Load datasetdf = pd.read_csv("College Readiness and Educational Experience Survey.csv")# Identify columnsq4 ="On a scale of 1 to 5, how prepared did you feel for college-level coursework when you started?\n(1 means not prepared at all, 5 means extremely well prepared)\n "q9_col ="How confident were you in managing your own time and responsibilities during your first semester of college?"q6 ="Did your high school offer support in the following areas?\n(Select all that apply)\n "idea_col ="Did you attend an IDEA Public School?"# Prep IDEA and Preparednessdf["IDEA"] = df[idea_col].map({"Yes": "IDEA", "No": "Non-IDEA"})df["Preparedness"] = pd.to_numeric(df[q4], errors="coerce")# Map Q9 responses to 1–5 scaletime_mgmt_mapping = {"Very confident": 5,"Somewhat confident": 4,"Neutral": 3,"Not very confident": 2,"Not at all confident": 1}df["TimeManagement"] = df[q9_col].map(time_mgmt_mapping)# Q6: Services — exact wordingservices = ["College application help","SAT or ACT prep","Financial aid guidance (FAFSA, scholarships)","Time management skills","Advanced coursework (AP or Dual Credit)","Career or major exploration","None of the above"# will ignore this for individual service analysis]# ---- PART 1: Breadth of services ----# Correct function to count servicesdef count_services(row):if pd.isna(row[q6]):return0 selected_raw = [s.strip() for s in row[q6].split(";") if s.strip() !=""]# Fix buggy value selected = []for s in selected_raw:if s =="Financial aid guidance (FAFSA, scholarships": s ="Financial aid guidance (FAFSA, scholarships)" selected.append(s) count =sum([1for s in selected if s !="None of the above"])return countdf["ServicesCount"] = df.apply(count_services, axis=1)# Function to compute mean by # of servicesdef compute_breadth_means(df, group, outcome): subset = df[(df["IDEA"] == group) & df[outcome].notna()] means = subset.groupby("ServicesCount")[outcome].mean()return means# ---- Plot Breadth vs Outcome ----def plot_breadth(outcome_col, outcome_label, title_suffix): means_idea = compute_breadth_means(df, "IDEA", outcome_col) means_nonidea = compute_breadth_means(df, "Non-IDEA", outcome_col)# Plot width =0.5 fig, axes = plt.subplots(1, 2, figsize=(13, 5), sharey=True)# IDEA x_idea = np.arange(len(means_idea)) axes[0].bar(x_idea, means_idea.values, width, color='#4C72B0') axes[0].set_xticks(x_idea) axes[0].set_xticklabels(means_idea.index) axes[0].set_ylim(0, 5) axes[0].set_ylabel(outcome_label) axes[0].set_title("IDEA Students Only")# Non-IDEA x_nonidea = np.arange(len(means_nonidea)) axes[1].bar(x_nonidea, means_nonidea.values, width, color='#4C72B0') axes[1].set_xticks(x_nonidea) axes[1].set_xticklabels(means_nonidea.index) axes[1].set_ylim(0, 5) axes[1].set_title("Non-IDEA Students Only") plt.suptitle(f"Breadth of Support Services vs {title_suffix}") plt.tight_layout(rect=[0, 0, 1, 0.95]) plt.show()# ---- Plot Breadth Charts ----plot_breadth("Preparedness", "Average Preparedness (1-5)", "College Preparedness")plot_breadth("TimeManagement", "Average Time Management Confidence (1-5)", "Time Management Confidence")# ---- PART 2: Individual services ----# Correct function to flag individual servicesfor s in services: colname =f"ServiceSelected_{s}"def service_selected(row):if pd.isna(row[q6]):return0 selected_raw = [x.strip() for x in row[q6].split(";") if x.strip() !=""] selected = []for x in selected_raw:if x =="Financial aid guidance (FAFSA, scholarships": x ="Financial aid guidance (FAFSA, scholarships)" selected.append(x)return1if s in selected else0 df[colname] = df.apply(service_selected, axis=1)# Function to compute mean by servicedef compute_service_means(df, group, outcome): means = {}for s in services:if s =="None of the above":continue# skip for individual service analysis colname =f"ServiceSelected_{s}" subset = df[(df["IDEA"] == group) & df[outcome].notna()] mean_score = subset[subset[colname] ==1][outcome].mean() means[s] = mean_scorereturn means# ---- Plot Individual Services vs Outcome ----def plot_services(outcome_col, outcome_label, title_suffix): means_idea = compute_service_means(df, "IDEA", outcome_col) means_nonidea = compute_service_means(df, "Non-IDEA", outcome_col)# Plot fig, axes = plt.subplots(1, 2, figsize=(13, 6), sharey=True)# IDEA axes[0].scatter(range(len(means_idea)), list(means_idea.values()), color='#4C72B0') axes[0].plot(range(len(means_idea)), list(means_idea.values()), color='#4C72B0') axes[0].set_xticks(range(len(means_idea))) axes[0].set_xticklabels(list(means_idea.keys()), rotation=15, ha='right') axes[0].set_ylim(0, 5) axes[0].set_ylabel(outcome_label) axes[0].set_title("IDEA Students Only")# Non-IDEA axes[1].scatter(range(len(means_nonidea)), list(means_nonidea.values()), color='#4C72B0') axes[1].plot(range(len(means_nonidea)), list(means_nonidea.values()), color='#4C72B0') axes[1].set_xticks(range(len(means_nonidea))) axes[1].set_xticklabels(list(means_nonidea.keys()), rotation=15, ha='right') axes[1].set_ylim(0, 5) axes[1].set_title("Non-IDEA Students Only") plt.suptitle(f"Individual Support Services vs {title_suffix}") plt.tight_layout(rect=[0, 0, 1, 0.95]) plt.show()# ---- Plot Individual Services Charts ----plot_services("Preparedness", "Average Preparedness (1-5)", "College Preparedness")plot_services("TimeManagement", "Average Time Management Confidence (1-5)", "Time Management Confidence")# ---- Outlier detection (individual services only) ----q15_col = [c for c in df.columns if"Do you feel your high school prepared you for the major"in c][0]outlier_rows = []for s in services:if s =="None of the above":continue colname =f"ServiceSelected_{s}" service_outliers = df[ ((df[colname] ==1) & (df["Preparedness"] ==1)) | ((df[colname] ==1) & (df["TimeManagement"] ==1)) ]ifnot service_outliers.empty:for _, row in service_outliers.iterrows(): outlier_rows.append({"IDEA": row["IDEA"],"Service": s,"Preparedness": row["Preparedness"],"TimeManagement": row["TimeManagement"],"Q15_Response": row[q15_col] })# Create outliers summary dataframeif outlier_rows: outliers_summary_services = pd.DataFrame(outlier_rows)else: outliers_summary_services = pd.DataFrame(columns=["IDEA", "Service", "Preparedness", "TimeManagement", "Q15_Response"])```# Conclusion and RecommendationsThis survey analysis highlights several actionable insights for school and network leaders who want to strengthen college readiness outcomes. Many of the patterns align with expectations. For example, stronger skills development and broader access to support services are linked with higher preparedness. However, the findings also reveal important nuances and areas for further attention.First, several results suggest that breadth of services alone is not sufficient. Quality, alignment, and communication about supports also matter. Even students with access to many services sometimes reported low preparedness, while others who perceived limited support still felt ready. This underscores the importance of making sure that services are both high-quality and well-matched to students’ academic and career pathways. It is also important to ensure that students are clearly informed about what is available.Second, outlier responses and open-ended comments consistently pointed to the role of career alignment and credit applicability in shaping preparedness. Students expressed frustration when coursework or supports did not match their intended fields or when earned credits failed to transfer. This suggests a need to more intentionally align high school experiences, especially advanced coursework and advising, with students’ postsecondary goals.Third, the results highlight opportunities to strengthen teacher-student relationships and communication about support services. This is especially important in non-IDEA contexts where awareness gaps were evident. IDEA leaders should also consider monitoring variation across campuses, as responses indicated that quality and depth of supports may not be consistent across the network.In summary, while the survey results affirm the value of strong academic skills, extracurricular involvement, quality teaching, and robust support services, they also point to key areas where greater alignment, consistency, and communication could further strengthen college readiness outcomes.# Reflections and Next StepsThis survey provided useful insights into how students perceive their college readiness and which high school experiences they view as most helpful. At the same time, several limitations should be kept in mind.First, some subgroups had small sample sizes, especially among IDEA students in certain categories. This means that a few patterns in the charts may reflect individual variation rather than broader trends. Increasing participation across campuses would help strengthen future analyses.Second, because this is a self-reported survey, student perceptions do not always align with actual academic outcomes. Some students may feel prepared but struggle in college, while others may feel unprepared but succeed. It would be valuable to compare these survey results with data on first-year college performance to better understand how perceptions relate to outcomes.Finally, this analysis raised new questions that could guide future work. For example, how do combinations of supports (such as dual enrollment with strong advising) influence readiness? How consistently are services implemented across campuses? What factors help students translate available supports into meaningful preparation? Deeper qualitative follow-up or expanded quantitative tracking could help answer these questions.# Appendix: Full Survey Response Table```{python}import pandas as pd# Load datasetdf = pd.read_csv("College Readiness and Educational Experience Survey.csv")# Display the full table exactly as in the CSVdf```